

Percent of opportunities ABA is a derived measurement that answers a precise question: out of the defined chances for a response to occur, how many opportunities included that response? The basic calculation is straightforward—count the opportunities with the target response, divide by the total number of opportunities, and multiply by 100. If a learner responds on 4 of 5 opportunities, the result is 80%.
Table of Contents
- What Is Percent of Opportunities ABA?
- How Do You Calculate Percent of Opportunities?
- When Is This the Best Measurement?
- Percent of Opportunities Versus Other ABA Measures
- How to Collect the Data Correctly
- Worked ABA Examples
- Common BCBA Exam and Fieldwork Mistakes
- How to Interpret the Result
- FAQ
- Sources to Verify the Method
- Take the Free BCBA Mock Exam
The difficult part is not the arithmetic. It is defining what counts as an opportunity, deciding what counts as a response, and keeping the denominator stable. A percentage can look impressive while still being misleading if opportunities were missed, prompts were scored inconsistently, or the measure was used for behavior that could occur many times between opportunities.
This BCBA measurement guide explains when percentage of opportunities fits, how it differs from percent correct, rate, duration, latency, and interval recording, and how to avoid the denominator errors that appear in exam questions and fieldwork documentation. The current BCBA Test Content Outline, Sixth Edition places measurement selection, occurrence, validity, reliability, and representative data in Domain C. Table of Contents
What Is Percent of Opportunities ABA?
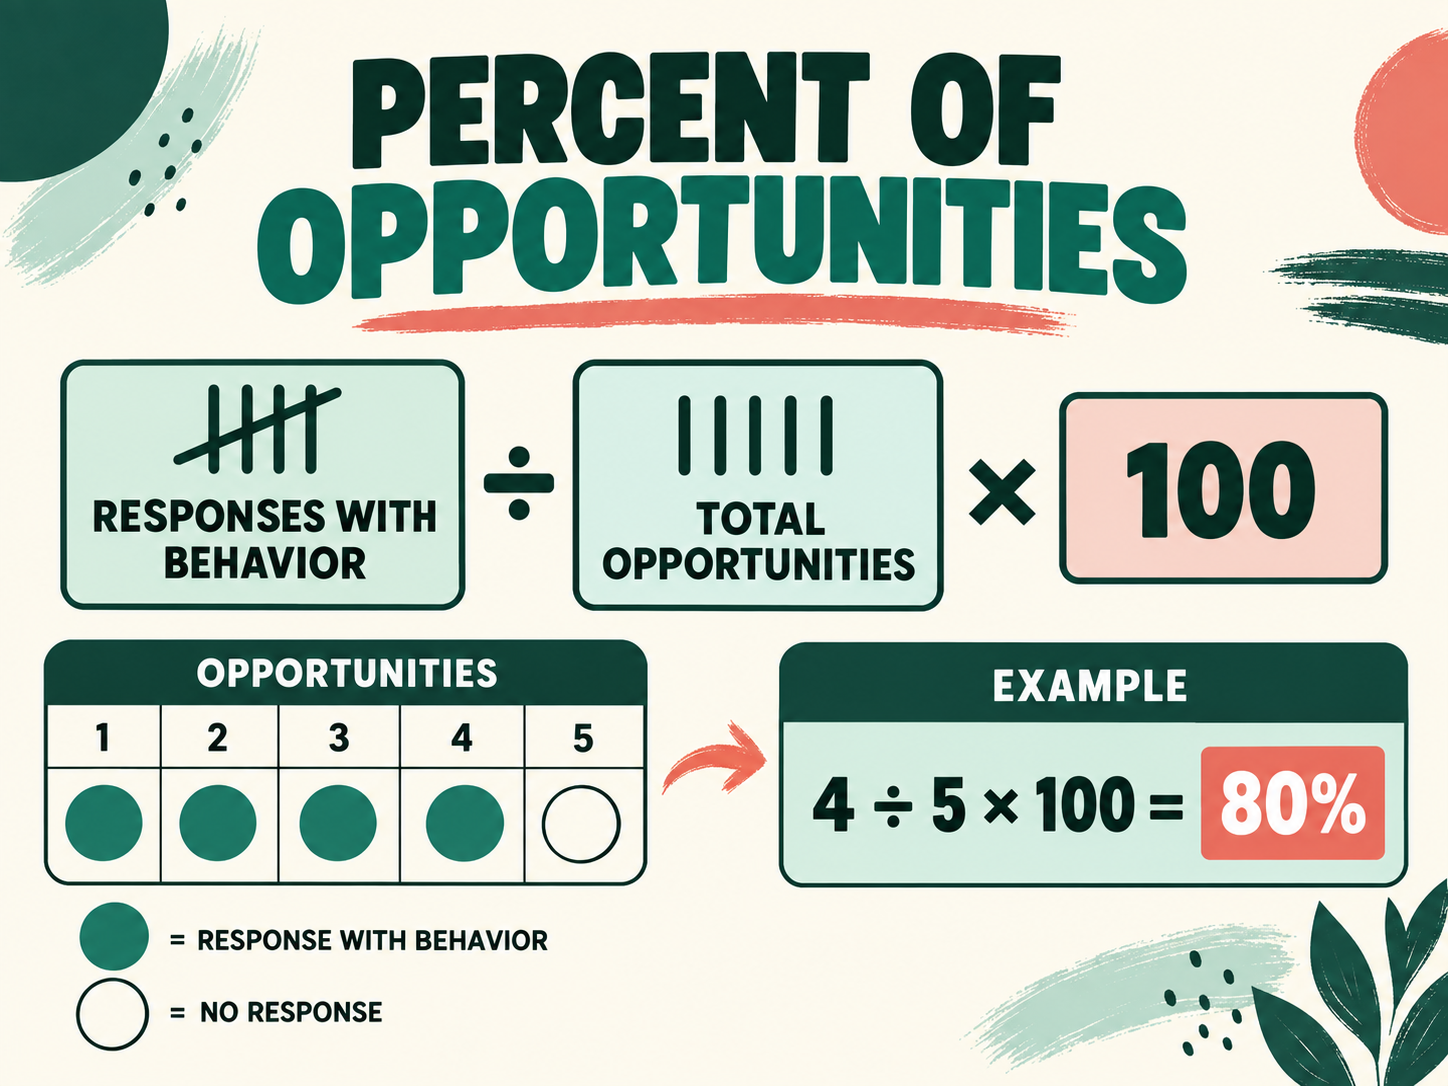
Percentage of opportunities is a way to summarize occurrence when the environment creates identifiable chances for a behavior. The denominator is not the number of minutes observed. It is the number of opportunities presented or naturally available under the operational definition. The numerator is the number of those opportunities in which the target response met the scoring rule.
For example, imagine that a learner is given five opportunities to request a break. The team defines an opportunity as a clear task presentation followed by a pause long enough for the learner to respond. If the learner independently uses the break card on four of those opportunities, independent break-card responding is 4/5 × 100 = 80%.
That result does not mean the learner used the card for 80% of the session, and it does not mean the learner made four total responses. It means the learner met the defined response criterion during 80% of the scored opportunities. The meaning depends on the operational definition, prompt rules, opportunity sequence, and missing-data policy. A sound percentage-of-opportunities measure usually has these features:
- Identifiable opportunities: the observer can tell when a chance to respond begins and ends.
- One consistent scoring rule: each opportunity is coded using the same definition for correct, incorrect, prompted, no response, or not scorable.
- A meaningful denominator: the total number of opportunities is recorded rather than guessed after the session.
- A critical dimension: the measure represents the skill or behavior the team actually needs to evaluate.
How Do You Calculate Percent of Opportunities?
Use the formula below when each opportunity is scored for whether the target response occurred or met the selected criterion: Percent of opportunities = (opportunities with the target response ÷ total scored opportunities) × 100
- Define the opportunity. State the event that makes the response possible, such as a direction, question, communication temptation, transition cue, or task step.
- Define the target response. Specify what counts, including timing, independence, topography, and any accuracy requirement.
- Count every scored opportunity. Record opportunities even when the learner does not respond, responds incorrectly, or needs a prompt, unless the protocol says the trial is not scorable.
- Count the opportunities that meet the criterion. The numerator must use the same opportunity set as the denominator.
- Divide and convert. Divide the numerator by the denominator and multiply by 100. Round consistently and report the number of opportunities with the percentage.
Suppose a learner answers 7 of 10 presented questions independently. The independent percentage of opportunities is 7 ÷ 10 × 100 = 70%. If the learner answered 7 independently, 2 with a verbal prompt, and missed 1, the report should not hide the prompt level. “70% independent across 10 opportunities” is more useful than simply writing “70% correct.”
If the denominator is zero, there is no percentage to calculate. Report that no opportunities were observed or created, and explain why. Do not enter 0% unless the protocol says that zero opportunities should be interpreted as zero performance; mathematically, zero divided by zero is undefined.
When Is This the Best Measurement?
Percentage of opportunities is a good fit when a target response is expected after a restricted, countable chance. The peer-reviewed decision model A Proposed Model for Selecting Measurement Procedures describes percentage of opportunities as useful for behavior that can occur only when a relevant condition is present, such as a demand, instruction, or other event. Common examples include:
- Following a direction within a defined interval after each instruction.
- Using a functional communication response when a motivating situation is arranged.
- Answering questions correctly across discrete teaching trials.
- Completing a task-analysis step when the step is presented.
- Using a replacement response instead of problem behavior during each defined opportunity.
- Implementing a treatment component correctly during each opportunity for procedural-fidelity scoring.
The measure is less appropriate when behavior can happen repeatedly without a clearly bounded opportunity. A child may engage in hand flapping, vocal behavior, or off-task behavior many times during an observation. If there is no defensible opportunity structure, frequency, rate, duration, latency, or a discontinuous procedure may represent the behavior better.
Selection should also consider environmental constraints. The TCO does not make one measurement system correct for every target; it asks future BCBAs to select a procedure that represents the critical dimension while accounting for the setting and available resources. The question is not “Which percentage is easiest?” It is “Which measure answers the clinical or learning question without distorting the behavior?”
Percent of Opportunities Versus Other ABA Measures
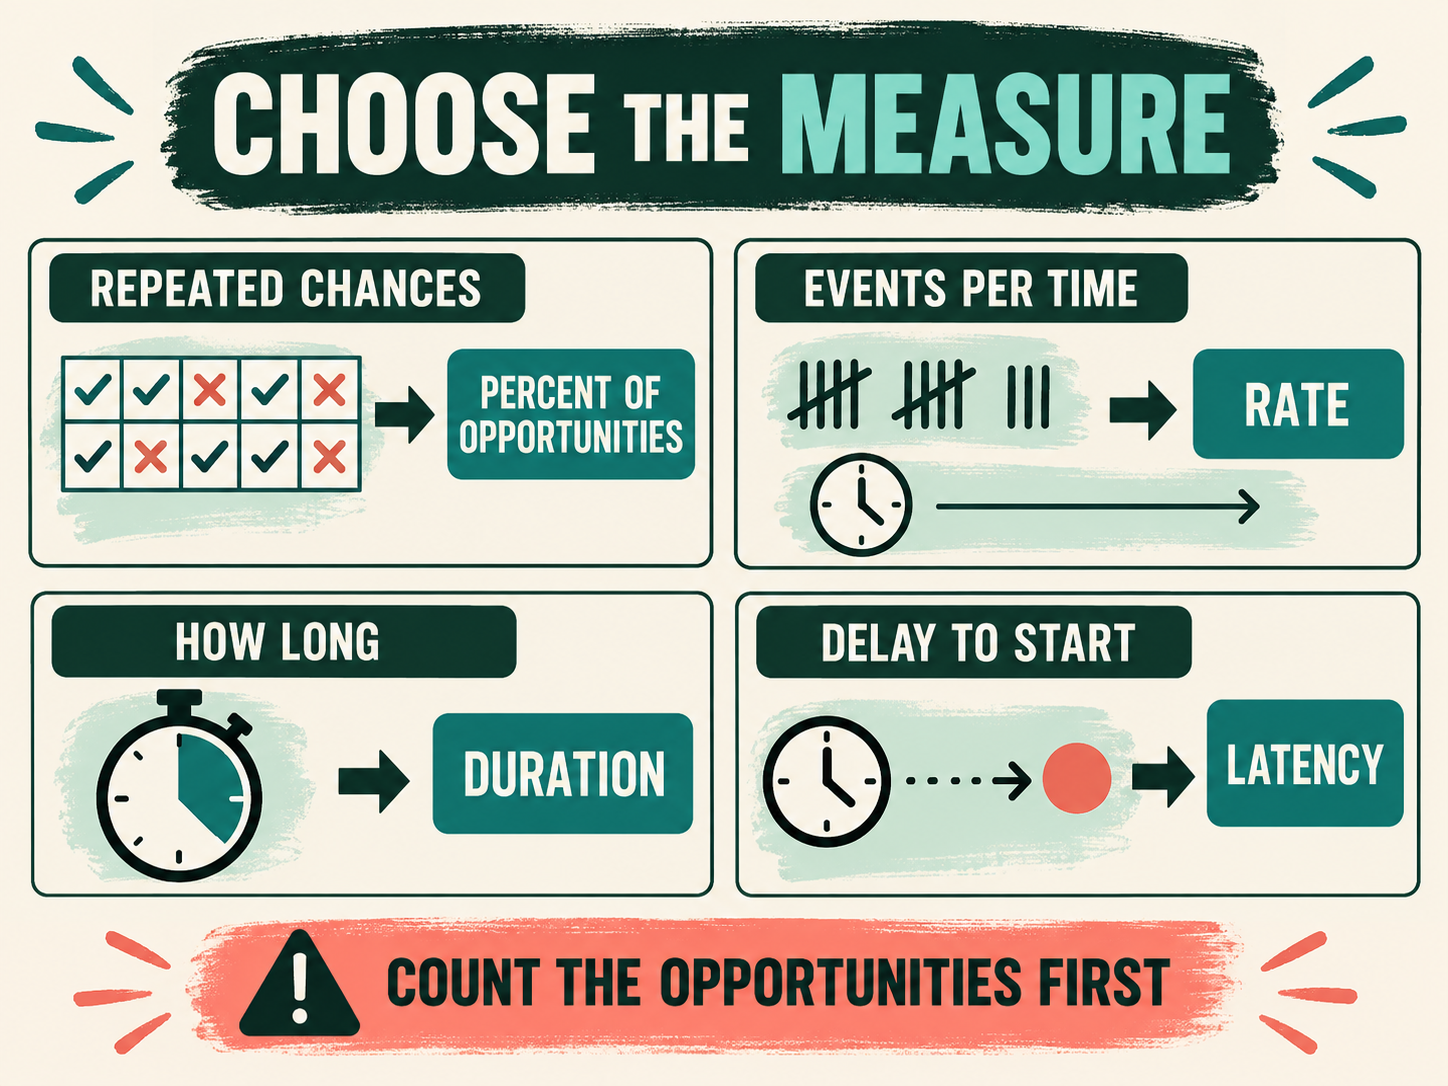
The fastest way to choose a measurement is to identify what the question asks: performance across chances, events per unit of time, how long behavior lasts, how long a response takes to begin, or whether behavior occurred during sampled intervals. The table below keeps the denominators and units visible.
| Measure | Question answered | Basic summary | Watch for |
|---|---|---|---|
| Percent of opportunities | On what percentage of defined chances did the response occur? | Opportunities meeting criterion ÷ total opportunities × 100 | Unclear opportunities or changing denominators |
| Percent correct | How many scored responses were correct? | Correct responses ÷ defined scored responses × 100 | It can look identical to opportunity scoring when every trial has one correct/incorrect response, but the scoring rule still matters |
| Rate | How often did the behavior occur per unit of time? | Count ÷ observation time | Do not replace repeated event measurement with a percentage when time is the critical dimension |
| Duration | How long did each episode or the behavior total last? | Elapsed time, often total or mean duration | A brief and a prolonged episode should not be treated as identical events |
| Latency | How long between the cue and the response beginning? | Time from instruction or cue to response onset | A response can occur on every opportunity but still have a clinically important delay |
| Interval recording | Did the behavior occur during sampled intervals? | Intervals scored according to partial, whole, or momentary rules | An interval percentage is not automatically a percentage of opportunities |
How to Collect the Data Correctly
A practical data-collection workflow prevents most errors before the calculator is opened:
- Write the opportunity definition first. Include the antecedent, the response window, and when the opportunity closes.
- Decide whether prompts count. You may need separate columns for independent, prompted, incorrect, and no response rather than one combined percentage.
- Make the denominator visible. Use a tally, trial row, or electronic field that records every opportunity presented.
- Record missed and interrupted opportunities. Do not silently delete difficult trials. Mark them according to the protocol and explain exclusions.
- Check observer agreement when appropriate. Two observers should apply the same opportunity and response definitions, especially when the result will guide treatment or documentation.
- Review opportunity quality. A low score may reflect an unclear cue, an impossible response requirement, poor timing, or an instructional mismatch—not only learner performance.
- Graph the data with context. Pair the percentage with dates, setting, prompt level, number of opportunities, and meaningful phase changes.
Small denominators deserve caution. A learner who responds on 1 of 1 opportunity has 100%, but that does not establish stable mastery. Reporting “100% across one opportunity” is more honest than displaying 100% without the denominator. The same principle applies to a 0% result across one opportunity.
Worked ABA Examples
Example 1: Functional communication: A team arranges 12 defined chances for a learner to request help. The learner independently uses the agreed communication response during 9 opportunities and uses a prompt during 3. Independent responding is 9 ÷ 12 × 100 = 75%. If the team reports prompted-or-independent responding, that is a different numerator and must be labeled separately.
Example 2: Skill-acquisition trials: A learner is presented with 8 picture-identification trials. Six responses meet the accuracy criterion without a prompt, one is incorrect, and one is not completed. If the protocol counts the incomplete trial as a scored opportunity, independent performance is 6/8 = 75%. If the trial was genuinely not scorable under the protocol, the denominator may be 7, but that exclusion must be documented. The calculation should never change simply to improve the percentage.
Example 3: Repeated behavior without discrete opportunities: During a 10-minute observation, a learner engages in 18 vocal stereotypy events. There are no defined opportunities that occasion each event. A percentage of opportunities would invent a denominator. Frequency or rate is more defensible: 18 events in 10 minutes, or 1.8 events per minute.
Common BCBA Exam and Fieldwork Mistakes
- Using minutes as the denominator: if the question asks about chances to respond, time is not the denominator.
- Counting only successful trials: the denominator must include scored opportunities without the target response.
- Confusing prompt level and occurrence: a prompted response may count as occurrence but not as independent or correct performance.
- Calling every percentage “percent correct”: the label should match the numerator and scoring rule.
- Using opportunities for freely occurring behavior: without a bounded chance, frequency, rate, duration, or interval measurement may fit better.
- Ignoring opportunity quality: an absent cue, unclear instruction, or impossible response can make the trial invalid.
- Overreading one session: a percentage without the number of opportunities, context, and trend is weak evidence.
How to Interpret the Result
A percentage is a summary, not a diagnosis of why performance changed. If the number rises, ask whether independent behavior improved, prompts increased, opportunities became easier, or the observer changed the scoring rule. If it falls, inspect the antecedent, response definition, prompt fading, reinforcer access, task difficulty, and opportunity count before changing an intervention.
For professional practice, measurement should be useful, valid, reliable, representative, and respectful of the learner. A high percentage is not automatically a meaningful outcome if the target lacks social validity or the response is achieved through excessive prompting. A low percentage is not automatically a learner deficit if the opportunity was poorly arranged. Use the measure to support a functional decision, not to replace one.
For BCBA exam preparation, translate the scenario into three questions: What is the opportunity? What is the response criterion? What is the correct denominator? Once those are clear, the formula is usually the easy part. The free BCBA mock exam can provide optional scenario practice after you understand the measurement logic; it is not a substitute for supervision, a data-collection protocol, or a clinical decision.
FAQ
What is the formula for percent of opportunities in ABA?: Divide the number of scored opportunities in which the target response met the criterion by the total number of scored opportunities, then multiply by 100. For 8 successful opportunities out of 10, the result is 80%.
Is percent of opportunities the same as percentage of occurrence?: They may describe similar calculations when each opportunity is scored for whether a behavior occurred, but terminology varies. Confirm the numerator, denominator, and response rule on the data sheet. Do not assume that the labels mean the same thing across programs.
Is percentage of opportunities the same as percent correct?: They can produce the same number when every trial has one response and the only scoring options are correct or incorrect. They are not automatically interchangeable: percent correct emphasizes accuracy, while percentage of opportunities emphasizes responding across defined chances. Report the actual scoring rule.
When should I use rate instead?: Use rate when repeated responses per unit of time are the important dimension, especially when the number of opportunities is undefined or session lengths differ. For example, 18 events in 10 minutes can be summarized as 1.8 events per minute rather than an invented opportunity percentage. What if there are no opportunities?: Do not automatically report 0%. Record that no opportunities were observed or arranged and explain the reason. A percentage requires a nonzero, defensible denominator.
Sources to Verify the Method
- BACB BCBA Test Content Outline, Sixth Edition — measurement and procedure-selection tasks.
- A Proposed Model for Selecting Measurement Procedures — measurement decisions for restricted opportunities.
- From Percentages to Precision — limits and interpretation issues when percentages hide important detail.
- Units of Analysis in Task-Analytic Research — why the unit and denominator matter.
Bottom line: percent of opportunities ABA is useful when the environment creates clear, countable chances for a response. Define the opportunity, record every scored trial, keep prompts visible, select a denominator that represents the behavior, and report the percentage together with its context.
Take the Free BCBA Mock Exam
If you want a low-pressure way to check your recall, use the free practice resource below. Take the Free BCBA Mock Exam



