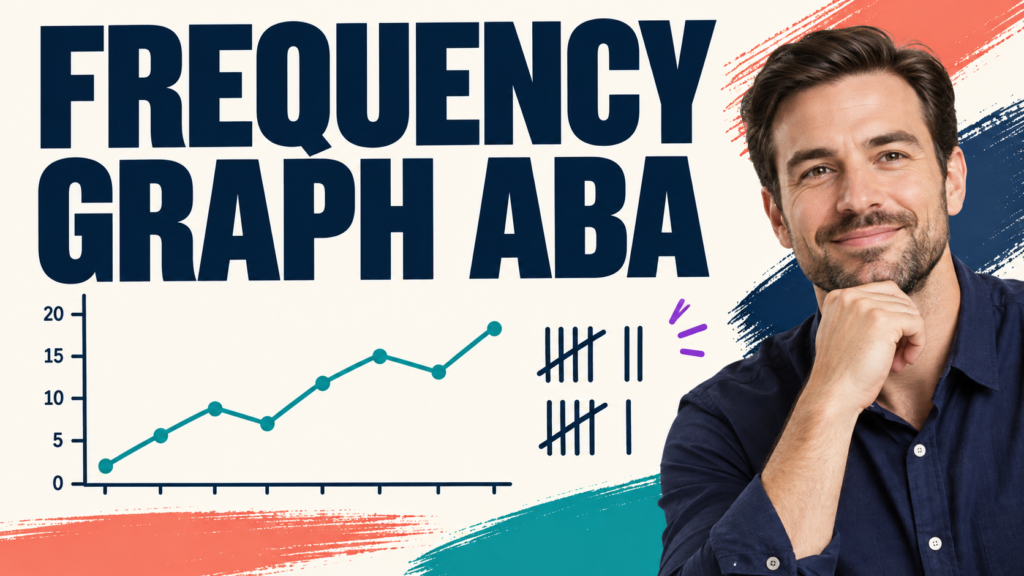
A frequency graph ABA learners can interpret should make the raw count, observation unit, sessions, phase changes, and visual-analysis questions obvious. The graph is only as useful as the operational definition and data behind it.
Table of Contents
- What Is a Frequency Graph in ABA?
- What Belongs on the Axes?
- How Do You Graph Frequency Data Step by Step?
- How Is Frequency Different From Rate and Percentage?
- How Should You Read Level, Trend, and Variability?
- What Does a Phase-Change Line Mean?
- How Can Frequency Graphs Support Decisions?
- What Data Problems Can Distort a Frequency Graph?
- When Is a Frequency Graph the Wrong Display?
- How Is Frequency Graph ABA Tested on the BCBA Exam?
- What Is the Bottom Line?
- Quick Review Checklist
- Take the Free BCBA Mock Exam
A frequency graph ABA page should answer two different questions: what does frequency mean, and how should a BCBA display and interpret those counts? Frequency is the number of times a defined behavior occurs during an observation period. A frequency graph puts those counts into a visual sequence so the team can inspect level, trend, variability, and changes across conditions.
Frequency is not automatically rate. A count of 18 events is frequency. A count of 18 events in 30 minutes can be converted to a rate of 0.6 events per minute. If observation periods vary, a raw frequency graph may make sessions look different simply because one session lasted longer. Choose and label the dimension that answers the clinical question. The BCBA task-list materials place measurement selection, graphing, and interpretation within exam scope. A graph should communicate the quantitative relation without inviting the reader to claim more than the data support.
What Is a Frequency Graph in ABA?
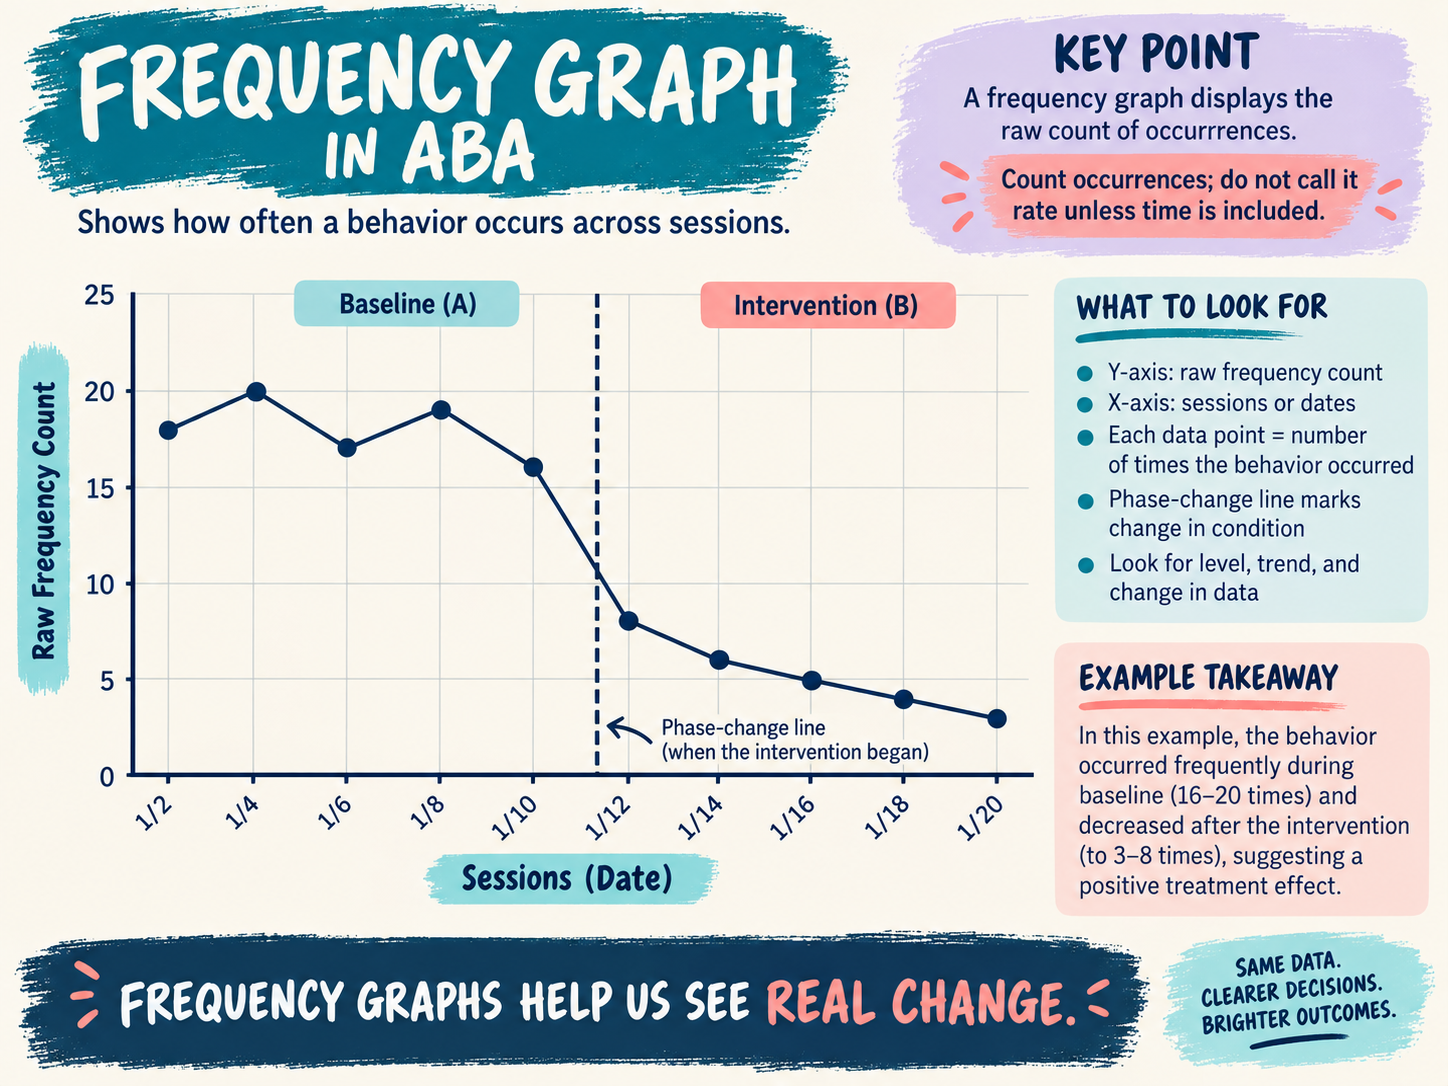
A frequency graph displays the number of occurrences of a behavior for each observation period. The horizontal axis commonly shows sessions or dates. The vertical axis shows frequency count. Each data point is the recorded number of defined events during the corresponding period.
For example, if an observer records 12 instances of calling out during Monday’s 30-minute class observation, the Monday point is 12. If the next observation lasts 45 minutes and contains 15 instances, the raw frequency is 15. The graph can display both numbers, but the reader should notice the unequal observation time before concluding that calling out increased.
A frequency graph is not a picture of a person. It is a display of a measurement produced by a definition, observer, context, and time or opportunity rule. A precise title and axis label protect that distinction.
What Belongs on the Axes?
Label the x-axis with the unit used for the observations: session number, date, observation period, or another meaningful sequence. Label the y-axis with the exact measure: frequency count, frequency of aggression, or number of independent requests. Avoid a generic label such as “behavior” because it hides the dimension.
Use a scale that makes the relevant changes visible without distorting the values. Keep the same scale when comparing phases unless there is a documented reason to change it. If the graph includes a phase-change line, label the conditions so the reader knows when baseline ended and intervention began.
Include a clear title, data points, and a legend when more than one series is displayed. Do not connect points across a missing observation as if a measurement occurred. Mark an interruption or use a note when the observation was not valid or the setting changed.
How Do You Graph Frequency Data Step by Step?
- Define the response: state what counts, including onset, offset, and examples and nonexamples.
- Choose the observation unit: record the same type of period or document why periods differ.
- Record every qualifying occurrence: use a tally or electronic entry that matches the definition.
- Verify the data: check for missing sessions, duplicate entries, impossible values, and observer drift.
- Plot one point per observation period: preserve the original count and date.
- Mark phase changes: label baseline, intervention, maintenance, or other conditions.
- Interpret visually: inspect level, trend, variability, immediacy, overlap, and consistency.
Software can draw the line, but it cannot decide whether a response met the operational definition or whether the observation periods are comparable. Automating the graph does not remove the need for data-quality checks.
How Is Frequency Different From Rate and Percentage?
Frequency is a raw count. Rate divides a count by a unit of time, such as responses per minute. Percentage expresses a proportion, often correct responses divided by opportunities. These dimensions may all be useful, but they are not interchangeable.
| Measure | Calculation or unit | Useful when | Interpretation trap |
|---|---|---|---|
| Frequency count | Number of occurrences | Observation periods are comparable and events have clear boundaries | More time observed can create a larger count |
| Rate | Count divided by time | Session lengths or exposure times vary | A rate still depends on a valid count and time unit |
| Percentage | Qualifying events divided by opportunities | The behavior occurs in defined trials or opportunities | A percentage hides the denominator if raw counts are omitted |
| Duration | Time engaged in the behavior | The length of an episode is the key concern | A single count does not describe how long behavior lasted |
How Should You Read Level, Trend, and Variability?
Level is the typical magnitude of the data within a phase. Trend is the overall direction: increasing, decreasing, or relatively flat. Variability is the degree to which points fluctuate. Read the three together. A mean can summarize data, but a mean does not show whether points were stable or widely scattered.
Suppose baseline frequency is 16, 18, 17, 19, and 16. A later phase is 9, 6, 8, 5, and 4. The visual impression is a lower level and a decreasing trend after the phase change. To interpret that pattern responsibly, ask whether the definition stayed constant, the observation time matched, the intervention began when marked, and other variables changed at the same time.
What Does a Phase-Change Line Mean?
A phase-change line separates conditions on the graph. It does not prove that the phase change caused the difference. In a single-case design, the strength of the causal inference depends on the design logic, repeated demonstrations or prediction and verification, procedural fidelity, and alternative explanations.
Label the conditions in plain language. “Baseline” and “intervention” may be enough for a simple study, but “break-card teaching plus differential reinforcement” gives a more informative record when the reader needs to know what changed. If the treatment package contains several components, do not assume the graph alone identifies which component produced the change.
How Can Frequency Graphs Support Decisions?
A graph can prompt a review of whether the target is changing, whether the intervention is being implemented, and whether a replacement behavior is increasing. Set decision rules before the data become emotionally persuasive. For example, the plan may specify when to continue, review fidelity, adjust a teaching component, or seek additional assessment.
Pair target frequency with relevant context. If the goal is to reduce property destruction, also measure safe communication or engagement when those responses are part of the plan. A target can decrease because a learner stopped participating, and the graph would look “better” even though quality of life did not improve.
What Data Problems Can Distort a Frequency Graph?
- Definition drift: observers gradually count a different topography or include borderline events.
- Unequal observation time: longer sessions create more opportunities for a raw count.
- Different contexts: comparing a quiet one-to-one session with a crowded class without labeling the change.
- Missing or invented zeros: a day without observation is not the same as a day with zero occurrences.
- Data-entry errors: duplicate events, impossible decimal values, or points assigned to the wrong date.
- Observer reactivity: the observer or data system changes the routine being measured.
Use observer training and interobserver agreement when the decision warrants it. Agreement does not prove that the definition measures the right construct, but low agreement can reveal that the definition or recording procedure needs review.
When Is a Frequency Graph the Wrong Display?
Choose another measure or display when the question concerns time engaged, latency, interresponse time, percentage of opportunities, or an accumulated total. Frequency may be inappropriate when episodes have no clear boundaries, occur too quickly to count reliably, or observation periods differ in ways that make raw counts misleading. A rate graph, duration graph, percentage graph, interval display, or cumulative record may communicate the relevant relation more clearly.
How Is Frequency Graph ABA Tested on the BCBA Exam?
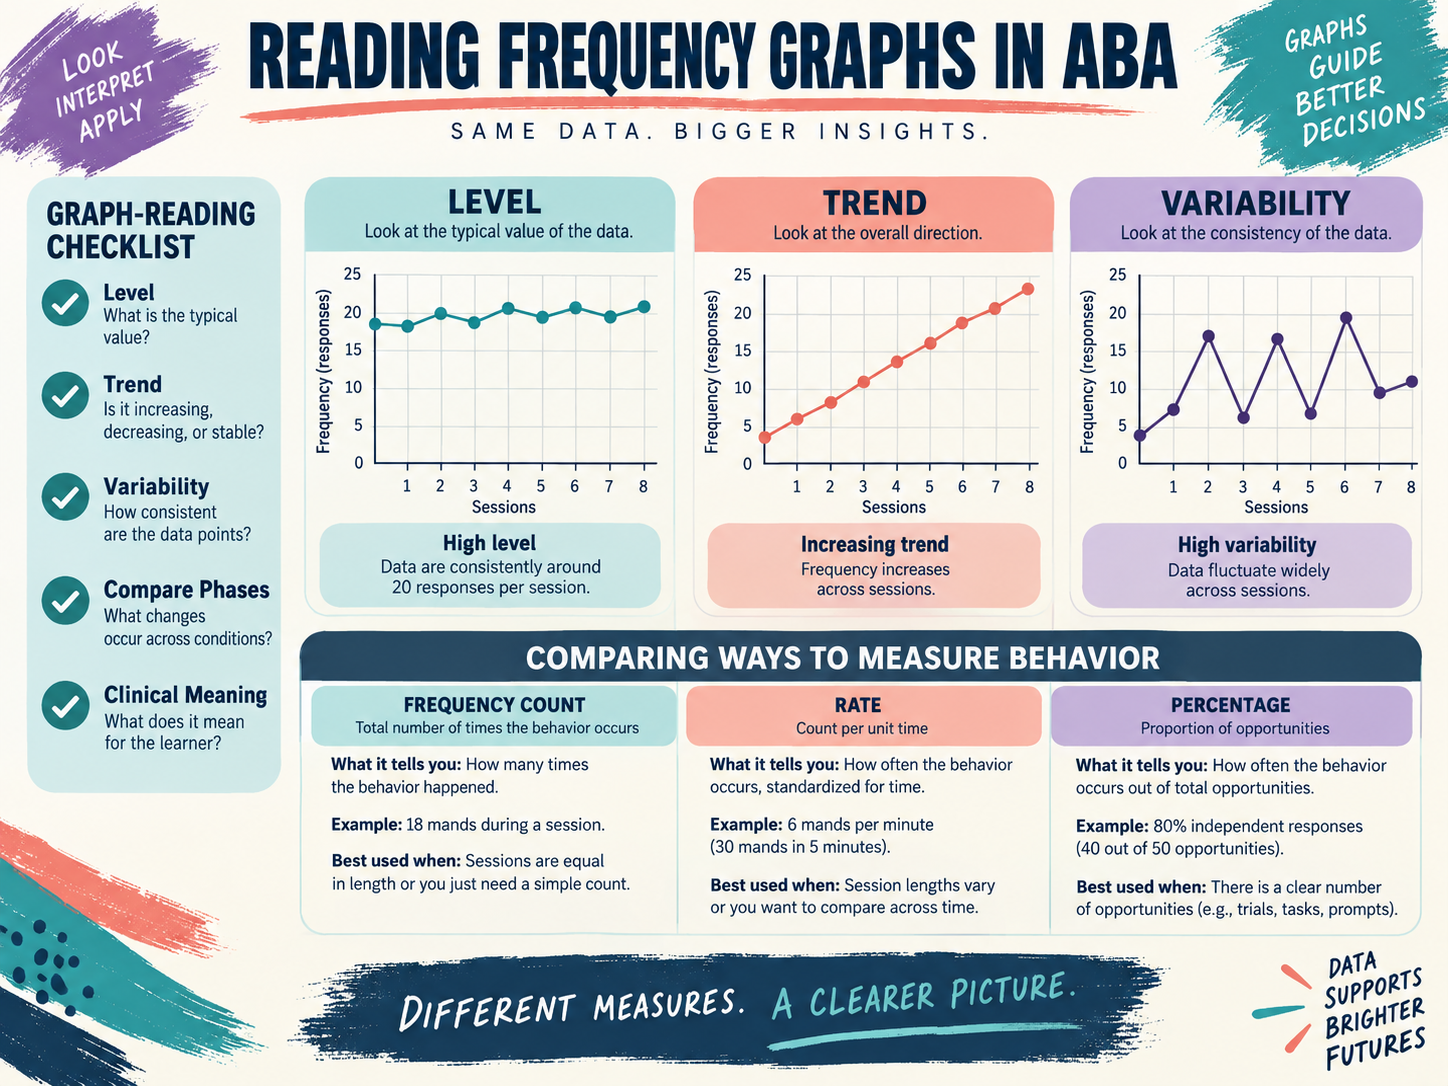
Look for the denominator. If a stem says “17 occurrences during a 30-minute observation,” the frequency is 17 and the rate is 17 per 30 minutes, or 0.57 per minute. If it says “9 independent responses out of 12 opportunities,” the natural summary is a percentage. If the stem emphasizes the running total over successive responses, consider a cumulative record rather than a session-by-session frequency graph.
For graph interpretation, identify the axes, phase labels, and visual-analysis features before choosing an answer. A downward path may be desirable for a reduction target and undesirable for a skill-acquisition target. The direction must be interpreted in relation to the operational goal.
What Is the Bottom Line?
A frequency graph ABA team members can trust begins with a stable operational definition and a comparable observation rule. Plot raw counts with clearly labeled axes, mark phase changes, inspect level, trend, and variability, and convert to rate when time differs. The graph supports decisions; it does not replace clinical reasoning, fidelity checks, or the learner’s priorities.
For a structured review of measurement and graph interpretation, try the free BCBA mock exam. Practice can help you choose between frequency, rate, percentage, duration, and cumulative displays without treating one graph as a universal answer.
For targeted review, use our frequency graph ABA practice questions to apply the concept in exam-style scenarios.
Quick Review Checklist
Use this final checklist to turn frequency graph ABA into exam-ready reasoning. The goal is not to memorize a label in isolation; it is to identify the relevant evidence and explain why the best answer fits the scenario. Key ideas to review:
- State the central definition or decision point for frequency graph ABA in your own words.
- Identify the detail that makes frequency graph ABA different from its closest related ABA term.
- Separate the observable facts in a scenario from assumptions that are not supported by the facts.
- Write one example and one nonexample so you can recognize the concept in a new setting.
Exam application checks:
- Ask what the question is actually requesting before comparing the answer choices.
- Mark the antecedent, response, consequence, or other evidence that supports the selected answer.
- Look for a distractor that describes a related process but does not answer the specific question.
Final self-check:
- Explain how you would verify the interpretation with clear observations or data.
- Change one detail in the scenario and decide whether your answer should change.
- Give a one-sentence rationale that a supervisor or study partner could evaluate.
Take the Free BCBA Mock Exam
When you are ready to apply the idea, use the free practice resource below for additional feedback. Take the Free BCBA Mock Exam