
What a Single-Stimulus Assessment Measures
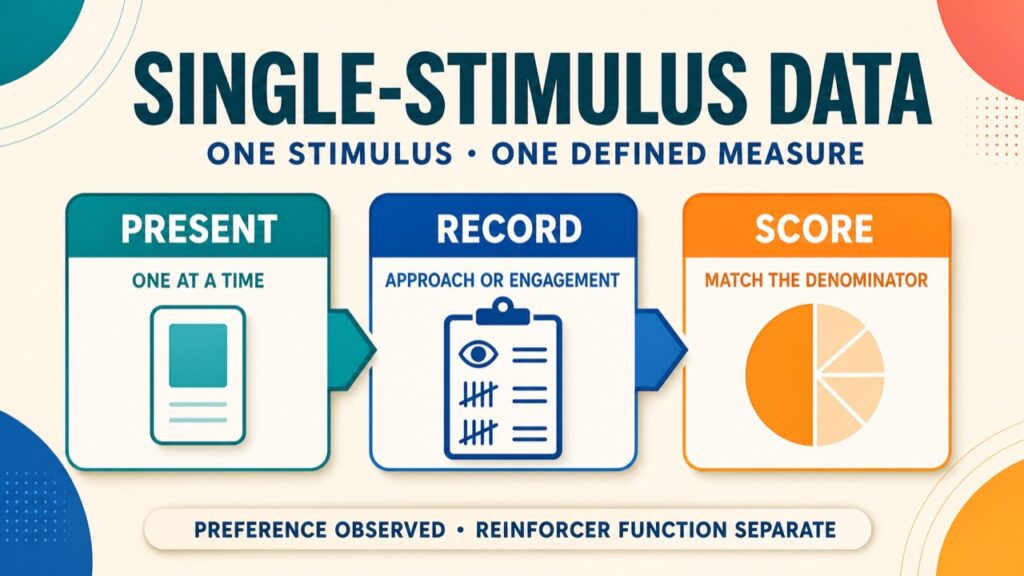
A single-stimulus preference assessment, also called a successive presentation assessment, presents one stimulus at a time across repeated, standardized opportunities. The data collection method for single stimulus preference assessment depends on the response selected before the assessment begins. A classic version records whether an approach occurs on each presentation. A single-stimulus engagement version records how long engagement occurs during a defined access opportunity. These are related procedures, but their numerators and denominators are not interchangeable.
Table of Contents
- What a Single-Stimulus Assessment Measures
- Approach-Based Data Collection
- Engagement-Duration Data Collection
- How the Methods Differ
- Build a Usable Data Sheet
- Interpret Results Within Context
- What the Primary Studies Show
- Study Checklist and Next Steps
The response definition needs to be observable and accessible for the individual. An assessment team might define approach as contact with an item within a stated opportunity, but another person may require a different active or passive response definition. Engagement might involve manipulating an object, consuming an edible item, activating a device, or another observable interaction. The definition should come from person-specific observation and collaboration, not from diagnosis, motor status, or a generic template. Planned indicators of rejection, withdrawal, or assent also require their own operational definitions; topography alone does not establish what a response means.
Approach-Based Data Collection
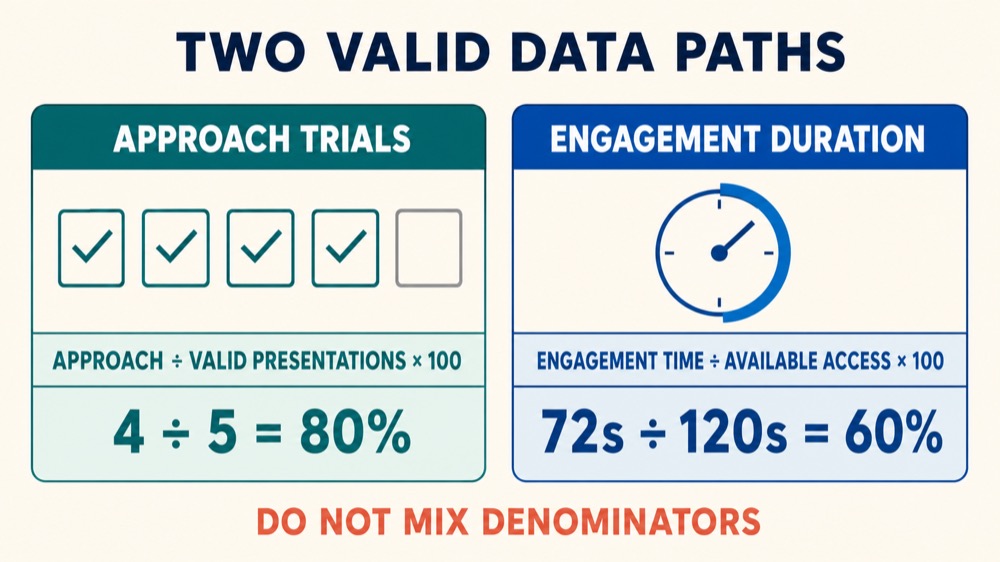
In an approach-based single-stimulus preference assessment, one stimulus is presented during a discrete opportunity. The observer records approach or no approach according to the prewritten definition and opportunity window. The main calculation is:
Percentage approached = approach trials ÷ total valid presentations × 100.
Suppose an item is presented five times and the defined approach occurs on four valid presentations. Four divided by five equals 80%, so the item has an 80% approach score. That arithmetic is an illustration, not a recommended number of trials or a decision threshold.
- Record the opportunity: identify the stimulus, presentation number, order, and whether the presentation was valid.
- Record the response: mark approach or no approach without converting an observation into a judgment about preference, refusal, or assent.
- Protect the denominator: document an interruption or procedural error and apply the preplanned rule for invalid presentations.
- Keep optional measures separate: latency, consumption, or rejection may be useful when defined in advance, but they do not replace the approach-trial denominator.
Order and recent access can influence responding, so presentation sequences may be randomized or counterbalanced and relevant contextual variables documented. Sampling exposure, prompts, access after a response, and intertrial arrangements should be consistent with the written procedure. There is no universal approach percentage that converts an item into “high preference,” and a missed approach is not automatically evidence that an item is aversive or that assent was withdrawn.
Engagement-Duration Data Collection
A single-stimulus engagement assessment, or SSE, also presents one item at a time, but it provides a defined access opportunity and measures engagement duration. The calculation is:
Percentage engagement = total engagement duration ÷ total available access duration × 100.
If engagement totals 72 seconds across 120 seconds of available access, the percentage engagement is 60%. The values show the formula only; exposure duration, number of opportunities, and any interpretation bands need to be selected for the person and purpose rather than copied as universal rules.
- State when available access begins and ends, including how pauses or interrupted opportunities are handled.
- Define the start and stop of engagement so different observers can identify the same event.
- Record total available access duration as well as total engagement duration.
- If latency, frequency of engagement episodes, consumption, or rejection is collected, preserve it as a distinct measure.
Approach data and engagement data can both be informative, but combining them into one score obscures what was measured. An item may be approached quickly and then contacted briefly, or approached after a long latency and then used for most of the opportunity. Separate measures make those patterns visible without assuming one pattern is preferable in every application.
How the Methods Differ
The presentation arrangement, not the use of a timer, identifies the assessment format. Measuring duration during one-at-a-time opportunities does not turn SSE into a free-operant assessment.
- Approach-based single stimulus: one stimulus per opportunity; the primary datum is approach or no approach; scoring uses percentage approached.
- Single-stimulus engagement: one stimulus per access opportunity; the primary datum is duration; scoring uses percentage engagement.
- Paired-stimulus: two stimuli are presented together; the observer records the selection, and scoring commonly relates selections to choice opportunities.
- Free-operant: multiple stimuli remain concurrently available; the observer measures allocation or engagement without a required choose-one discrete trial.
A paired-stimulus procedure may produce a more differentiated preference hierarchy because every trial includes a competing option. A single-stimulus procedure can instead identify several acceptable stimuli, but broad approach or engagement may limit rank-order discrimination. That limitation is sometimes described as a false-positive risk: acceptance in isolation may not predict relative preference when alternatives compete. The appropriate follow-up depends on the learner, accessibility, assessment purpose, feasibility, and data—not a fixed hierarchy in which one method is always best.
Build a Usable Data Sheet
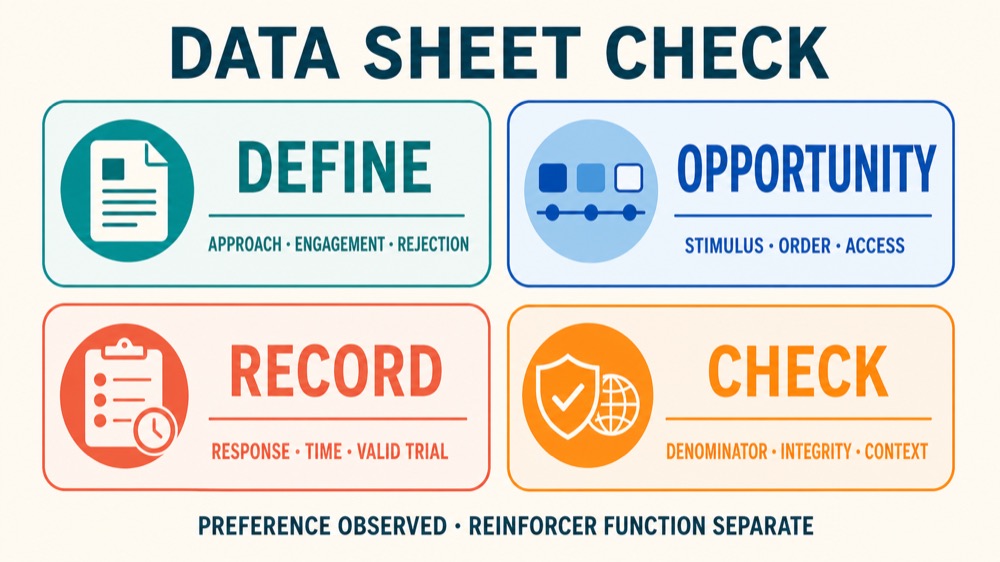
A useful data sheet makes the procedure auditable. It should let a reviewer reconstruct what was available, what response was defined, what happened, and which denominator produced the reported score.
- Stimulus identifier, presentation number, randomized or counterbalanced order, date, observer, and context.
- Operational definition for approach or engagement, plus any planned latency or rejection definition.
- Sampling exposure and access arrangement when used, valid-opportunity field, response occurrence or duration, and available access duration.
- Notes for interruptions, recent access, possible satiation or deprivation variables, observable withdrawal indicators, and procedural deviations.
- Treatment integrity items that match the written procedure, such as correct stimulus, timing, order, prompt, and consequence arrangement.
Rules for incomplete or invalid opportunities should be written before scoring. Silently removing a no-response trial, counting an interrupted trial as a full opportunity, or using planned time instead of actual available time changes the denominator. Position and order effects, inconsistent prompts, differential postresponse access, unclear timing rules, and inaccessible response definitions can also change the result. Agreement checks can evaluate recording consistency, while integrity checks evaluate whether the planned assessment was implemented; neither substitutes for the other.
Interpret Results Within Context
A high approach or engagement score is evidence of observed preference under the assessment conditions. It is not proof that the stimulus functions as a reinforcer. Preference describes allocation or interaction in an assessment arrangement. A reinforcer is identified when a consequence increases the future probability of the relevant behavior under a contingency. When that functional question matters, a separate reinforcer assessment or other appropriate contingency-based evaluation is needed.
Interpretation should retain the stimulus, setting, response definition, time, relevant establishing or abolishing variables, and comparison method. Results can shift after recent access, across settings, or when competing options become available. A narrow hierarchy, broad acceptance, low responding across all items, or inconsistent repeated results may each suggest a different next question. None supplies a universal clinical decision on its own.
- Check whether the recorded measure matches the planned variant and formula.
- Review missing opportunities, procedural deviations, integrity, and observer agreement before ranking items.
- Look for stability across repeated observations without imposing a universal repetition count.
- Use preference results as one input alongside feasibility, stakeholder input, observable assent or withdrawal indicators, and outcome data.
What the Primary Studies Show
The foundational Pace and colleagues study repeatedly presented 16 stimuli to six people and used approach data to identify higher- and lower-preference stimuli. Its procedure helped establish the one-at-a-time method, but the sample, stimulus count, exposure details, and response definition do not create universal parameters or guarantee that approach predicts a reinforcing effect.
Hagopian and colleagues evaluated SSE with four individuals. Duration-based rankings closely corresponded with paired-stimulus rankings for two participants, while the SSE rankings predicted relative reinforcing effects for all four in a later concurrent assessment. Those findings distinguish the preference assessment from the later reinforcer comparison and remain results from a small, study-specific evaluation.
In a 14-participant comparison, approach-based single-stimulus and paired-stimulus procedures did not yield identical results; paired presentation generally produced more differentiated hierarchies in that sample. An accessibility-focused study with three children examined active approach, passive approach, and rejection measures when minimal movement made common selection responses difficult. It illustrates why accessible, individualized definitions may be needed, not why a diagnosis or motor label can choose the measure automatically.
Study Checklist and Next Steps
- First identify whether one stimulus, two stimuli, or several concurrent stimuli are available.
- For discrete approach trials, use approach trials divided by valid presentations.
- For SSE duration, use engagement duration divided by available access duration.
- Do not mix denominators, invent a universal cutoff, or equate a preference score with reinforcer function.
- Match the response definition to the individual and verify both recording quality and implementation integrity.
For broader method selection, review the Assessment in ABA guide. When the question shifts from observed preference to behavioral effect, see the reinforcer assessment guide. The current BACB BCBA Test Content Outline lists designing and evaluating preference assessments in F.4; it does not prescribe one universal single-stimulus scoring protocol or predict what appears on an individual exam form.
Use the Free BCBA Mock Exam for broader practice and feedback. This educational guide supports study, but it does not replace supervised training, person-specific assessment, or qualified professional judgment.
Next step for BCBA exam prep
Turn this topic into exam-day practice
Use this topic as a focused review, then test it in exam-style conditions with a free mock before deciding whether five full-length mocks are the right next step.
Start the Free BCBA Mock ExamContinue with Five Full-Length Mocks — $99
Review the included materials and access details before ordering. No pass guarantee is implied.



