
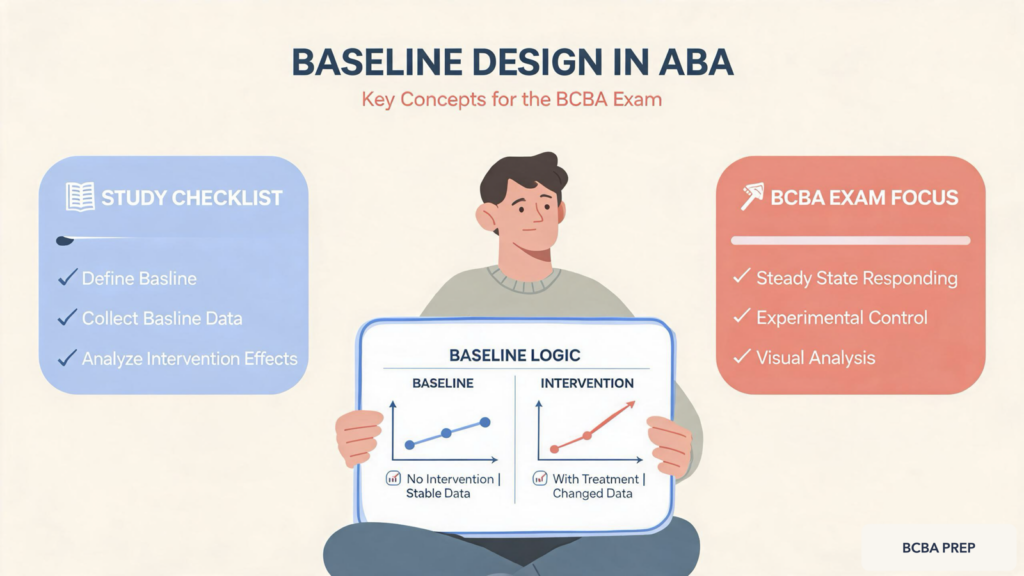
What Is Baseline Design in ABA?
Baseline design refers to the initial phase of a single-subject research or intervention where behavior is measured under natural conditions without any intervention. The purpose is to establish a steady state of responding that allows the practitioner to predict what the behavior would look like if no treatment were applied. In the BCBA exam, you are often asked to interpret baseline data to determine if an intervention is warranted and to evaluate experimental control.
Practice this concept
Before a full mock exam, practice baseline-design reasoning with BCBA experimental design questions.
Table of Contents
- What Is Baseline Design in ABA?
- Worked Examples of Baseline Design with ABC Analysis
- Why Baseline Design Matters for the BCBA Exam
- Quick Checklist for Evaluating a Baseline Design
- Final Summary
Key Features of a Stable Baseline
A stable baseline shows minimal variability, a clear level, and a predictable trend. Variability refers to the degree of fluctuation in data points; a stable baseline has low variability. Level is the average rate of behavior, and trend is the direction (increasing, decreasing, or flat). Steady state responding is achieved when the behavior pattern is consistent enough to serve as a reliable predictor. Without a stable baseline, it is difficult to attribute any behavior change to the intervention.
Baseline vs. Intervention Logic (Prediction, Verification, Replication)
Baseline design is the foundation of the prediction, verification, replication logic in single-subject research. Prediction: based on baseline data, you forecast the behavior path without intervention. Verification: when you introduce the intervention and see a change, you verify that the change is due to the intervention. Replication: by repeating the intervention across conditions or subjects, you confirm the effect. Baseline provides the prediction step; without a solid baseline, the entire logic collapses.
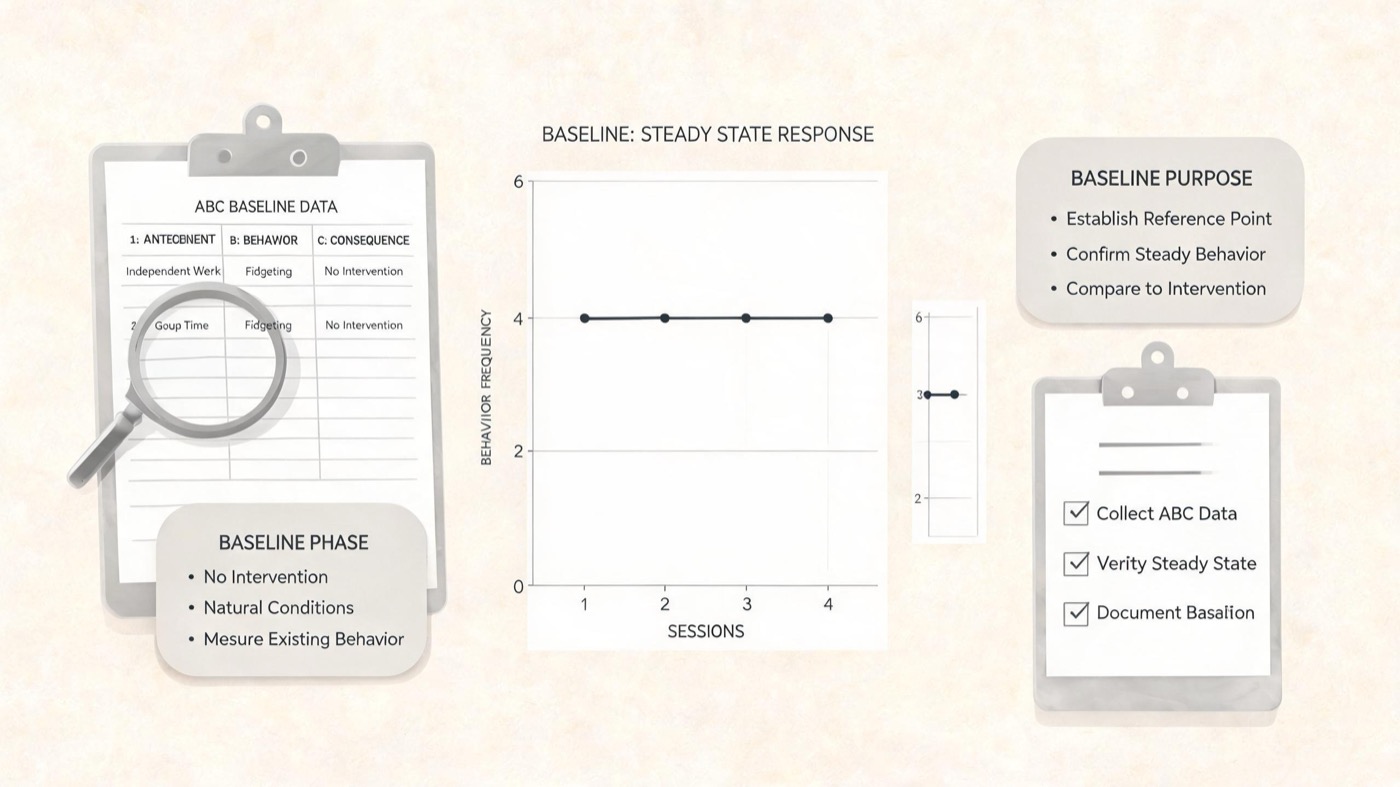
Worked Examples of Baseline Design with ABC Analysis
Example 1: Reducing Off-Task Behavior in a Classroom
A teacher collects ABC baseline data on a student’s off-task behavior (looking away, fidgeting). The baseline shows a stable, high rate of off-task behavior with a slightly increasing trend. The antecedent is difficult math worksheets; the consequence is teacher redirection (escape from task). Hypothesized function: escape from task demands. Intervention: provide breaks after completion. The baseline design allows the team to confirm that the intervention reduces off-task behavior compared to the predicted path.
Example 2: Increasing Peer Interaction in a Child with Autism
Baseline data show the child initiates peer interaction only 2 times per 30-minute observation. The level is low and stable. Intervention: peer modeling and social stories. The hypothesized function is social positive reinforcement (peer attention). The baseline design provides a prediction of low rates, making the increase during intervention meaningful. Visual analysis of the graph shows clear change from baseline to intervention phases.
Example 3: Self-Injurious Behavior in a Clinical Setting
Baseline shows highly variable and high-rate self-injurious behavior (SIB). The variability makes it difficult to predict. Intervention: noncontingent reinforcement (NCR) with access to preferred sensory items. Hypothesized function: automatic reinforcement (sensory stimulation). Despite variable baseline, the intervention data show a dramatic reduction, supporting experimental control. This example illustrates that even a less stable baseline can be used if the intervention effect is large and immediate.
Example 4: Compliance with Instructions in Early Intervention
Baseline data show compliance at 30% on average with high variability (range 10-50%). The trend is flat. Intervention: high-probability request sequence (high-p) increases compliance to 80% with low variability. Hypothesized function: social positive reinforcement (praise after compliance). The baseline design demonstrates prediction (likely continued low compliance) and verification (increase with intervention). This example highlights the need to examine both level and variability in baseline.
Why Baseline Design Matters for the BCBA Exam
The BCBA exam frequently tests your ability to interpret baseline data from graphs. You may be asked to identify whether a baseline is stable enough to introduce an intervention, or to choose the correct baseline logic (prediction, verification, replication). Understanding baseline design helps you evaluate experimental control and avoid common exam traps.
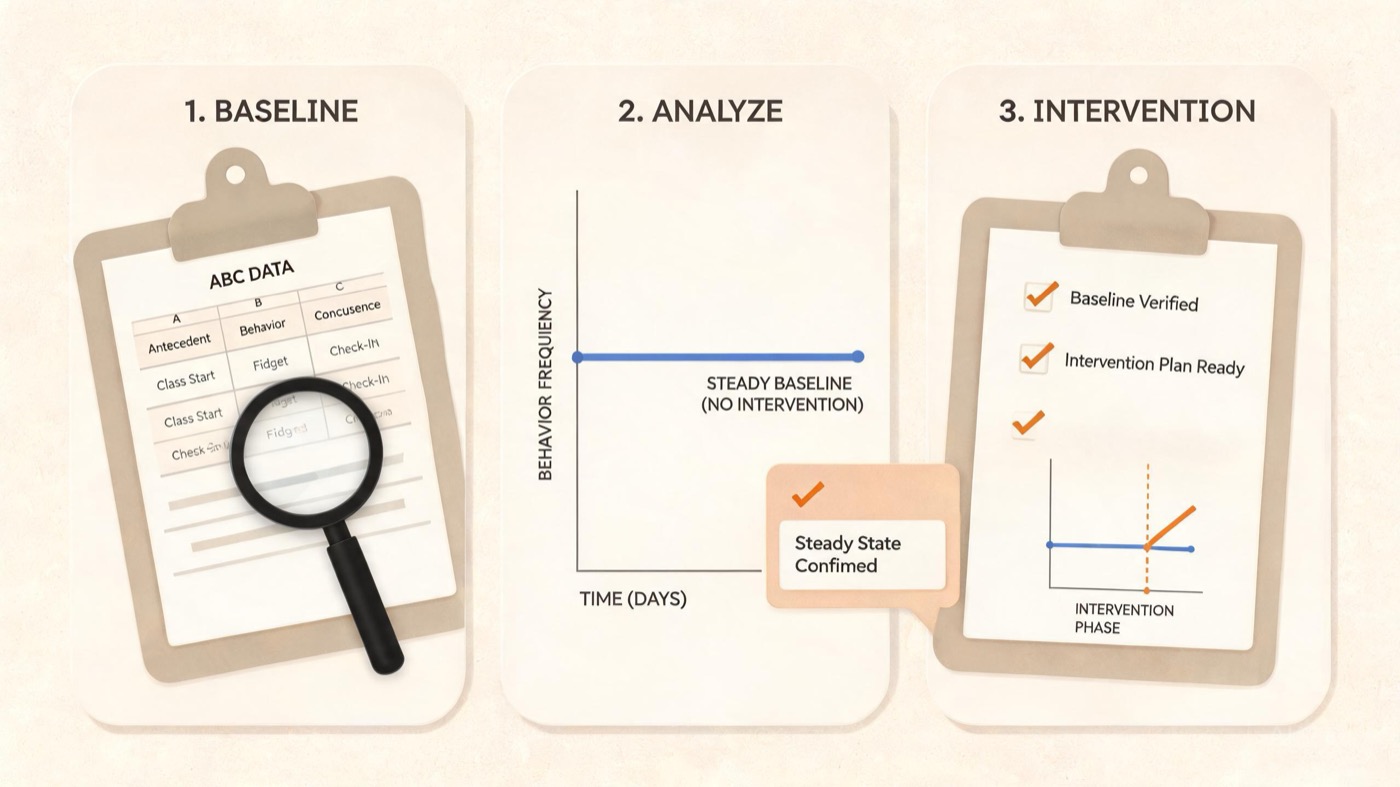
Common Exam Traps with Baseline Design
- Confusing baseline length with stability: A long baseline does not guarantee stability. Stability is judged by variability, level, and trend, not duration.
- Misinterpreting trend vs. level: An increasing trend in baseline does not mean the behavior is stable; it means it is changing. A stable baseline should have no clear trend.
- Assuming baseline means no intervention at all: In some designs, baseline may include existing supports or natural contingencies. The key is that the independent variable is not manipulated.
- Ignoring within-session patterns: A graph may show stability overall but high variability within sessions. Exam questions may test whether such a baseline is adequate.
- Thinking baseline is always necessary: Some designs (e.g., alternating treatments) may not require a traditional baseline, but most single-subject designs do.
Quick Checklist for Evaluating a Baseline Design
Use this checklist to assess baseline quality in exam questions or in practice. Each item addresses a key element of stable baseline criteria.
- Check variability: Are the data points within a narrow range? Low variability increases confidence in prediction.
- Check trend: Is there a clear upward or downward trend? A flat trend is ideal for baseline.
- Check level: What is the average rate of behavior? Ensure the level is clinically meaningful.
- Check enough data points: A baseline should have at least 3–5 data points, but more are needed if variability is high.
- Check for outliers: Remove or explain extreme points that do not fit the pattern.
- Check for reactivity: Was the observer present? Reactivity can inflate or deflate baseline rates.
Final Summary
Baseline design is a cornerstone of single-subject research and a high-yield topic for the BCBA exam. Remember the three key features of a stable baseline: low variability, stable level, and flat trend. Use the prediction, verification, replication logic to evaluate experimental control. The worked examples in this guide show how baseline data inform functional hypotheses and intervention decisions. Avoid common traps by focusing on stability, not length. For more practice on interpreting graphs and experimental designs, check out our guide to single-subject experimental designs and graphing and visual analysis. For authoritative standards, refer to the BACB and the Journal of Applied Behavior Analysis.
Next step for BCBA exam prep
Turn this topic into exam-day practice
Use this topic as a focused review, then test it in exam-style conditions with a free mock before deciding whether five full-length mocks are the right next step.
Start the Free BCBA Mock ExamContinue with Five Full-Length Mocks — $99
Review the included materials and access details before ordering. No pass guarantee is implied.



