
Total count IOA is one of the quickest interobserver agreement calculations in applied behavior analysis. It compares the total number of responses recorded by two observers during the same observation period. The formula is simple, but the interpretation matters: a high total-count percentage can hide disagreement about when responses occurred.
Table of Contents
- Total Count IOA: What the Formula Measures
- The Total Count IOA Formula
- Step-by-Step Total Count IOA Calculation
- What Total Count IOA Cannot Tell You
- Compare Total Count With Related IOA Methods
- Common Total Count IOA Mistakes
- Quick Review Checklist
- Take the Free BCBA Mock Exam
- References
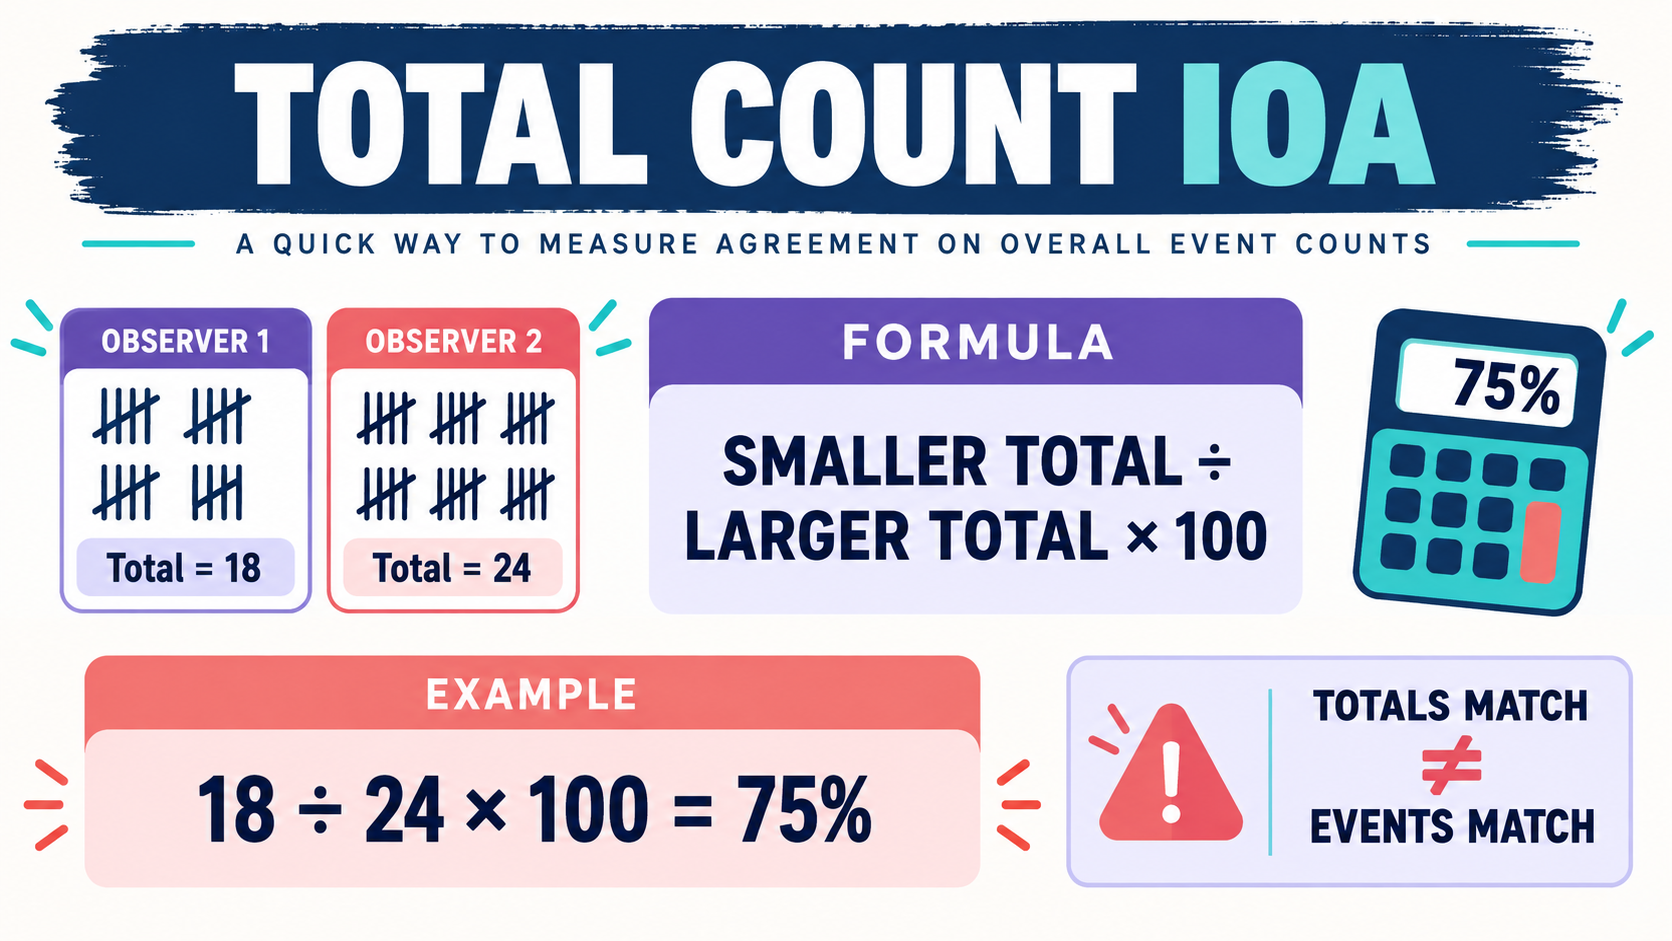
To calculate it, divide the smaller total count by the larger total count and multiply by 100. For example, if Observer 1 records 18 responses and Observer 2 records 24, total count IOA is 18 ÷ 24 × 100 = 75%. The result tells you how close the two session totals were; it does not prove that both observers recorded the same events at the same moments.
This guide explains the formula, walks through a clean calculation, and shows when another IOA method is a better fit. Use it as a BCBA exam study guide, but match the method to the measurement system and the question being asked. Table of Contents
Total Count IOA: What the Formula Measures
Total count IOA is designed for data reported as a total number of responses across an observation period. Each observer independently records the target response, then the two session totals are compared. The method is most direct when the important question is whether the observers obtained similar overall counts and the timing or distribution of individual responses is not the main focus.
The calculation is an agreement ratio, not a diagnostic of data quality by itself. A result of 90% means the smaller total is 90% of the larger total. It does not mean that 90% of the individual response events were matched. That distinction is a frequent BCBA exam trap because the word “agreement” can sound more precise than the method actually is.
The Total Count IOA Formula
Write the formula in words before inserting numbers: Total count IOA (%) = smaller observer total ÷ larger observer total × 100 The smaller value goes on top because the ratio should not exceed 100%. If both observers recorded exactly the same total, the ratio is 1 and the IOA is 100%. If one observer recorded zero and the other recorded a positive number, the ratio is 0 and the IOA is 0%. If both observers recorded zero, document how your course or protocol defines the result before interpreting it; the ordinary smaller-over-larger calculation would create a zero denominator.
| Observer 1 total | Observer 2 total | Calculation | Total count IOA |
|---|---|---|---|
| 18 | 24 | 18 ÷ 24 × 100 | 75% |
| 40 | 40 | 40 ÷ 40 × 100 | 100% |
| 0 | 5 | 0 ÷ 5 × 100 | 0% |
Step-by-Step Total Count IOA Calculation
When a question gives you two observer totals, use a short sequence rather than trying to calculate in your head. The sequence prevents the most common reversal error, which is placing the larger number in the numerator or treating a difference score as the IOA.
- Confirm the data type: make sure the numbers are total counts for the same behavior and the same observation period.
- Identify the smaller total: this becomes the numerator.
- Identify the larger total: this becomes the denominator.
- Divide: compute smaller total ÷ larger total.
- Convert to a percentage: multiply the decimal by 100 and label the result as total count IOA.
Suppose one observer records 32 instances and the other records 28. The smaller total is 28, so the calculation is 28 ÷ 32 × 100. The decimal is 0.875, which becomes 87.5%. Do not subtract 28 from 32 and report 4 as an agreement score; the difference can describe disagreement in counts, but it is not the total count IOA formula.
Also check the observation window. If one observer watched for 30 minutes and the other watched for 20 minutes, similar totals may be misleading because the observers did not have the same opportunity to record behavior. Align the session, target definition, and observation period before interpreting the percentage.
- Use the same operational definition of the target response.
- Confirm both observers scored the same session or observation window.
- Put the smaller count in the numerator.
- Multiply the decimal ratio by 100.
- Report the method name with the percentage.
What Total Count IOA Cannot Tell You
Aggregate totals can match even when observers disagree about the location, timing, or distribution of responses. Imagine that Observer 1 records two responses early and four late, while Observer 2 records four early and two late. Both totals are six, so total count IOA is 100%, yet the event-by-event records do not line up. If the intervention decision depends on when behavior occurred, the total alone is not enough.
This limitation does not make total count IOA automatically wrong. It means the method should be selected deliberately. For a simple frequency tally where the session total is the relevant summary, it may be an efficient check. For data divided into intervals or trials, a method that compares those units can reveal disagreements that the aggregate total hides.
- It does not show whether the observers agreed on each individual event.
- It does not show whether disagreements clustered in one part of the session.
- It does not test agreement on occurrence versus nonoccurrence in each interval.
- It does not correct a weak operational definition or inconsistent observer training.
Compare Total Count With Related IOA Methods
The BCBA Test Content Outline places measurement, data display, and interpretation within the examination content. The formula is easier to remember when you connect it to the measurement system rather than memorizing a list of names.
| Method | What is compared? | Main reason to distinguish it |
|---|---|---|
| Total count | Two session totals | Fast aggregate check for count data |
| Count-per-interval | Counts within corresponding intervals | Detects disagreement hidden by equal session totals |
| Trial-by-trial | Observer scores on each discrete trial | Fits trial-based correct/incorrect or prompted responses |
| Total duration | Shorter duration divided by longer duration | Used for duration data, not response counts |
On an exam, look for the unit named in the stem. “Total responses during the session” points toward total count IOA. “Each interval,” “each trial,” or “each occurrence duration” points toward a more specific method. Do not choose a formula because its percentage looks more favorable; choose the formula that matches the data.
Common Total Count IOA Mistakes
Most errors are small arithmetic or wording errors rather than difficult mathematics. Slow down long enough to label the observers, the unit of measurement, and the requested IOA method.
- Using larger total ÷ smaller total and producing a value above 100%.
- Reporting the raw difference between totals as the IOA percentage.
- Applying total count IOA to interval data when the question asks for interval agreement.
- Assuming 100% total-count agreement proves event-by-event agreement.
- Rounding too early and losing the decimal needed for the final percentage.
Quick Review Checklist
Before selecting an answer, ask yourself:
- Are both numbers totals from the same observation period?
- Which total is smaller?
- Did I divide the smaller value by the larger value?
- Did I multiply by 100 and name the method?
- Does the question require a count, interval, trial, or duration method instead?
Take the Free BCBA Mock Exam
After you can calculate the formula, practice deciding whether the method fits the measurement system. Our total count IOA practice questions can help you distinguish aggregate counts from interval, trial, and duration data in short BCBA-style scenarios. Practice supports recall, but it does not replace the measurement plan or supervision guidance used in real practice. Take the Free BCBA Mock Exam
References
- BACB BCBA Test Content Outline (6th ed.)
- BACB Test Content Outlines and Task Lists
- Worked IOA calculation reference



