
A duration graph ABA study guide should show more than a line with numbers. It should connect the behavior definition, recording window, y-axis, phase changes, and visual analysis so a BCBA can make a defensible decision.
Table of Contents
- What Does a Duration Graph Show?
- How Is Duration Different From Latency?
- How Do You Build a Duration Graph ABA Readers Can Use?
- How Do You Interpret Level, Trend, and Variability?
- How Should You Handle Zero, Missing, and Censored Duration?
- What Duration-Graph Mistakes Appear on the BCBA Exam?
- When Is Duration the Best Measurement?
- What Is the Bottom Line?
- Quick Review Checklist
- Take the Free BCBA Mock Exam
Duration graph ABA refers to displaying how long a target behavior lasts across observations, sessions, days, or conditions. Duration is a measure of temporal extent: the amount of time from the defined onset of a response to its defined offset. A graph makes those values easier to compare across baseline and intervention, but a graph cannot repair an unclear definition or inconsistent timing system.
For example, “tantrum lasted 4 minutes” is meaningful only when the team has specified what starts the episode, what ends it, whether pauses count, and what observation window was used. The BCBA Test Content Outline places observable measurement and data-based decision making at the center of competent practice. The graph is the visual summary of that measurement system.
What Does a Duration Graph Show?
The x-axis usually represents sessions, dates, trials, or another ordered observation unit. The y-axis represents the duration unit, such as seconds or minutes. Each point is the recorded duration for the target episode or the selected summary, such as total duration per session or mean duration per episode.
Choose the summary that matches the question. If the team wants to know how much of a 30-minute observation was occupied by behavior, total duration or percentage of session may be useful. If the question is whether individual episodes are becoming shorter, mean duration and range may be more informative. A total can decrease because there are fewer episodes, shorter episodes, or both, so keep frequency available when that distinction matters.
How Is Duration Different From Latency?
Duration measures how long a response continues after it begins. Latency measures the time between an antecedent or instruction and the start of the response. If a learner starts a task 20 seconds after an instruction and works for 6 minutes, latency is 20 seconds and duration is 6 minutes. They answer different questions and use different operational boundaries.
| Graph element | Decision | Example |
|---|---|---|
| X-axis | Order observations in time or condition | Session 1 through Session 12 |
| Y-axis | Label the duration unit and scale | Total minutes of refusal per session |
| Data point | Plot the defined summary for that observation | 8 minutes in Baseline Session 3 |
| Phase line | Mark a change in condition | Baseline to intervention |
How Do You Build a Duration Graph ABA Readers Can Use?
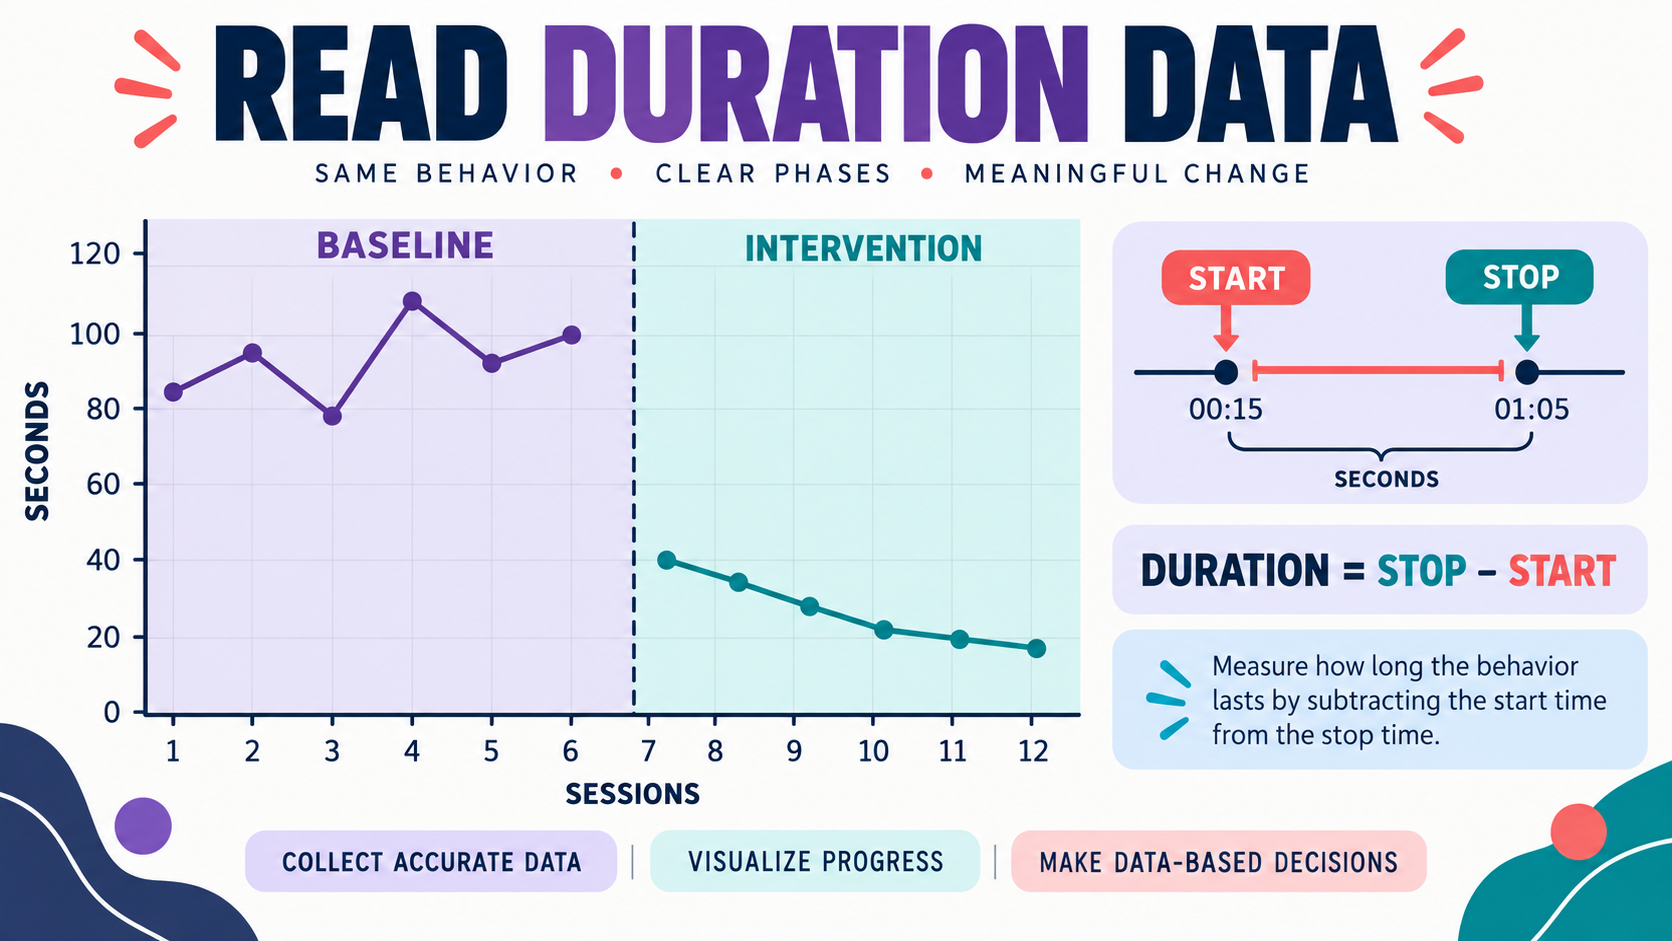
Begin with the operational definition and the observation plan. Decide whether you will record each episode, total duration per session, average episode duration, or a percentage of the observation. Use the same timer rule and observation length when comparisons require it. If observation time changes, document it because a longer window can create a larger total even when the rate of behavior is stable.
Enter the values in chronological order. Label baseline, intervention, generalization, maintenance, or other conditions above the relevant data points. Draw a phase-change line when the condition changes, and do not connect a point across the line as though it came from the same condition. The graph should make it possible to see when the intervention began and whether the data changed at that point.
How Do You Interpret Level, Trend, and Variability?
Level is the typical height of the data within a phase. Trend is the direction of change across time. Variability describes how much the points fluctuate. A successful intervention for reducing refusal duration might show a lower level, a downward trend, and less variability than baseline. A single low point is not enough to establish a reliable change.
Consider immediacy of effect and overlap. If duration drops immediately after the phase line and remains lower across several sessions, the intervention has stronger visual support than if the change is gradual and overlaps heavily with baseline. Also check whether a change in staff, schedule, health, or task difficulty could explain the pattern.
How Should You Handle Zero, Missing, and Censored Duration?
A true zero means the defined behavior did not occur during the observation and should be distinguished from missing data. If the observer did not attend, the timer failed, or the session ended early, mark the value as missing or censored according to the data system. Do not silently enter zero because it makes the graph look better.
If an episode continues when the observation ends, note that the recorded value is a minimum or use a planned rule for right-censored data. The team should know whether “10 minutes” means the behavior lasted exactly 10 minutes or was still occurring when the observation stopped.
What Duration-Graph Mistakes Appear on the BCBA Exam?
- Using latency as duration: time before a response starts is not the same as time the response continues.
- Changing observation length without noting it: total duration is sensitive to the size of the observation window.
- Connecting across a phase line: baseline and intervention points belong to different conditions.
- Calling missing data zero: absence of a record is not evidence that the behavior did not occur.
- Ignoring episode count: total duration can hide whether frequency or episode length changed.
- Starting with a vague target: a timer cannot make “meltdown” observable and reliable by itself.
When Is Duration the Best Measurement?
Duration is useful when the length of an episode matters, such as time engaged in an activity, time on task, time spent crying, or time required to complete a routine. It is less useful when the behavior is extremely brief and frequent or when the clinical question concerns how quickly a response starts. In those cases, frequency, rate, latency, or another dimension may be more sensitive.
Choose measurement based on the decision. If the treatment goal is “stay engaged for 10 minutes,” duration directly matches the goal. If the goal is “begin within 5 seconds,” latency is the better primary measure. Multiple measures can be collected when they answer different questions, but each one should earn its place in the plan.
What Is the Bottom Line?
A duration graph ABA workflow starts before the graph: define the response, choose the summary, standardize the observation window, and document phase changes. Then inspect level, trend, variability, immediacy, and competing explanations. For more practice with measurement and visual analysis, use the free BCBA mock exam. It can support studying, but real cases still require individualized assessment, supervision, and ethical decision making.
For targeted review, use our duration graph ABA practice questions to apply the concept in exam-style scenarios.
Quick Review Checklist
Use this final checklist to turn duration graph ABA into exam-ready reasoning. The goal is not to memorize a label in isolation; it is to identify the relevant evidence and explain why the best answer fits the scenario. Key ideas to review:
- State the central definition or decision point for duration graph ABA in your own words.
- Identify the detail that makes duration graph ABA different from its closest related ABA term.
- Separate the observable facts in a scenario from assumptions that are not supported by the facts.
- Write one example and one nonexample so you can recognize the concept in a new setting.
Exam application checks:
- Ask what the question is actually requesting before comparing the answer choices.
- Mark the antecedent, response, consequence, or other evidence that supports the selected answer.
- Look for a distractor that describes a related process but does not answer the specific question.
Final self-check:
- Explain how you would verify the interpretation with clear observations or data.
- Change one detail in the scenario and decide whether your answer should change.
- Give a one-sentence rationale that a supervisor or study partner could evaluate.
Take the Free BCBA Mock Exam
When you are ready to apply the idea, use the free practice resource below for additional feedback. Take the Free BCBA Mock Exam