
A latency graph ABA readers can trust begins with one precise interval: the time from a defined cue to the start of a defined response. This guide covers graph setup, visual analysis, and the exam traps that make latency easy to confuse with duration.
Table of Contents
- What Does Latency Measure?
- How Is Latency Different From Duration?
- How Do You Build a Latency Graph ABA Readers Can Use?
- How Do You Read the Pattern?
- What Should You Do With No Response?
- How Do Prompts Affect Latency Data?
- What Latency-Graph Mistakes Appear on the BCBA Exam?
- When Is Latency the Right Measurement?
- What Is the Bottom Line?
- Quick Review Checklist
- Take the Free BCBA Mock Exam
Latency graph ABA means displaying the delay between an antecedent or signal and the onset of a target response across sessions or conditions. If a teacher says “start writing” and the learner begins 18 seconds later, the latency is 18 seconds. The graph can show whether that delay decreases after an intervention, stays variable, or changes only in one setting.
Latency is a continuous measurement dimension when the observer attempts to record each relevant opportunity. The BCBA Test Content Outline emphasizes observable, measurable behavior and data-based decisions. A useful graph therefore depends on clear start and stop rules, consistent opportunities, and notes about factors that could change the delay.
What Does Latency Measure?
Latency starts when the defined antecedent occurs and ends when the target response begins. The antecedent might be an instruction, a conversational question, a safety cue, or the presentation of a material. The response must also have an observable onset. “Responds appropriately” is too broad unless the team defines what counts as the beginning of the response.
For a “start homework” target, the rule might be: start the timer when the instruction is delivered and stop it when the learner picks up the pencil and makes the first mark within the defined task. If the learner asks for clarification, the team needs a planned rule for whether the timer continues, pauses, or ends.
How Is Latency Different From Duration?
Latency measures time before a response begins. Duration measures how long the response continues after it begins. A learner may start a task quickly but work only briefly, or start slowly and then work for a long period. A graph of latency cannot answer the duration question, and a duration graph cannot show how quickly the response started.
| Dimension | Clock starts | Clock stops | Example question |
|---|---|---|---|
| Latency | Antecedent or cue | Response onset | How quickly does the learner begin? |
| Duration | Response onset | Response offset | How long does the behavior last? |
| IRT | End of one response | Start of the next response | How far apart are responses? |
How Do You Build a Latency Graph ABA Readers Can Use?
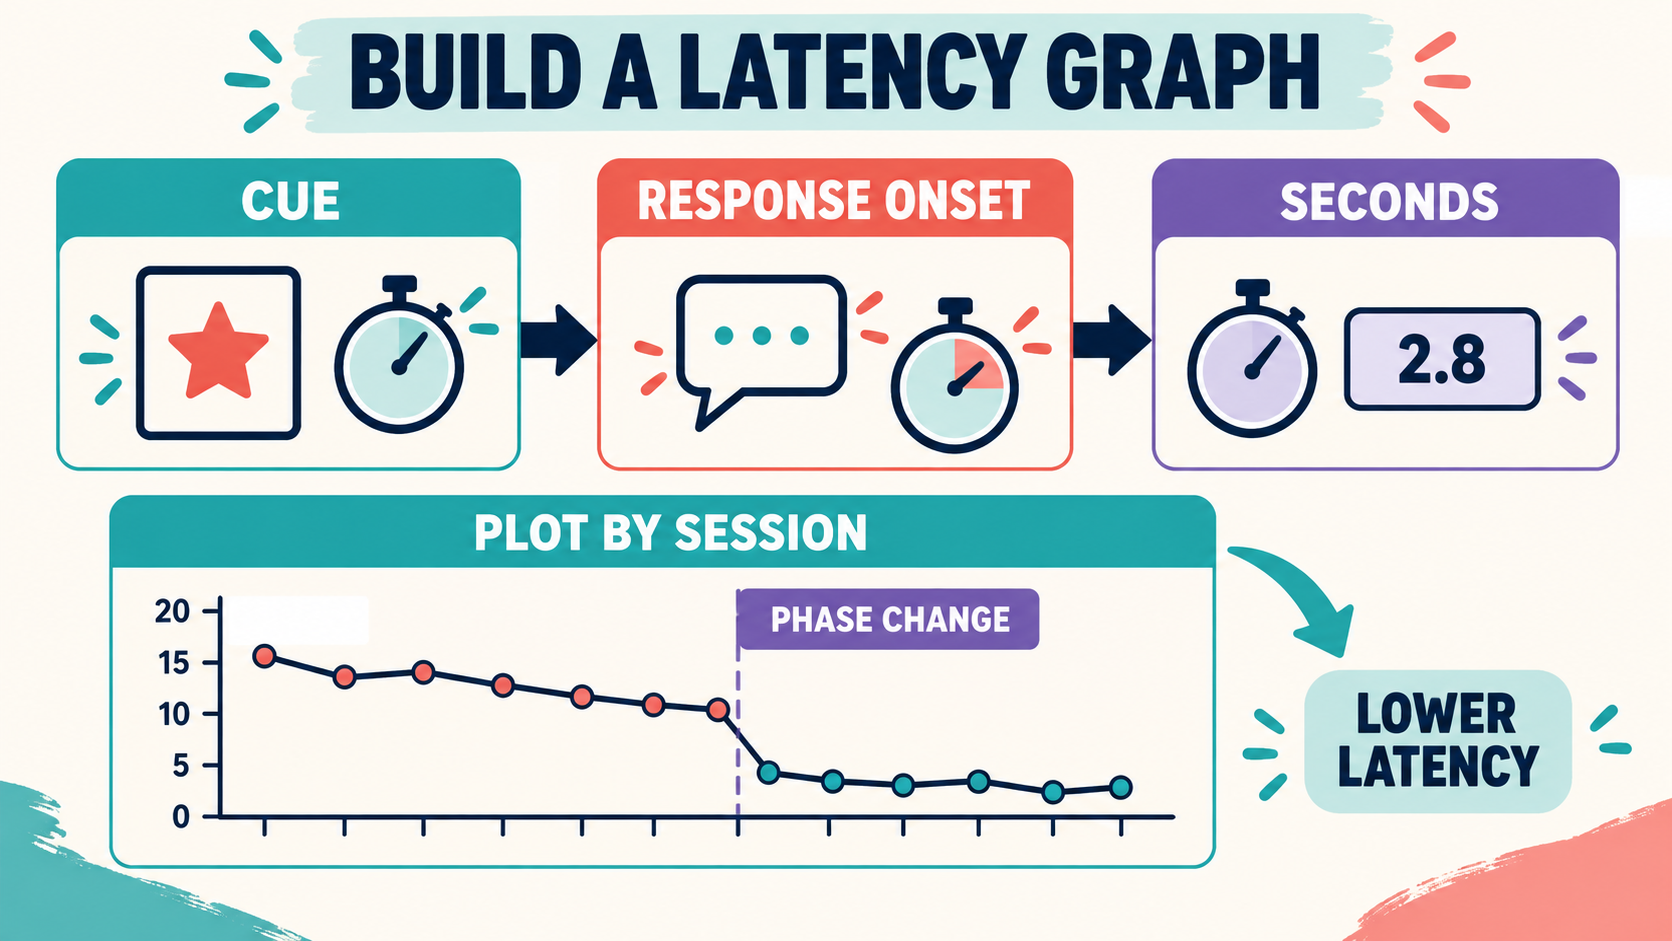
Choose the observation unit first. Many teams graph the mean latency per session, but median latency may better represent skewed values when one very long delay would distort the average. If every opportunity is important, preserve the opportunity-level data and state how the session summary was calculated.
Put sessions, dates, or opportunities in order on the x-axis. Label the y-axis with the time unit, such as seconds. Plot one point for the selected summary in each observation unit. Mark the phase change when the intervention, prompt, or teaching condition changes. Use a line graph when the question concerns change across time, and keep phase labels clear enough that another reader can reconstruct the sequence.
How Do You Read the Pattern?
For a goal to start a response more quickly, a lower latency is generally desirable. Compare level, trend, variability, and immediacy across phases. A consistent drop immediately after intervention is more informative than one low point. A flat line with large variability may indicate that the procedure has not reliably changed responding or that the opportunity definition is inconsistent.
Check the opportunity itself. Latency can change when the instruction becomes clearer, the task becomes easier, a prompt is added, the waiting interval changes, or the learner has more access to a preferred activity. Record those details so the graph is not interpreted as if the only variable was the named intervention.
What Should You Do With No Response?
A no-response opportunity is not automatically a zero-second latency. If the response never starts, use a planned censoring value, maximum latency rule, or separate no-response code. The choice should be specified before data collection and used consistently. A zero means the response began at the timing boundary; it should not stand in for “the response did not occur.”
If the observation ends before the response begins, document that the latency is at least the time observed. A graph that treats every uncompleted opportunity as a small number will make performance look faster than it was.
How Do Prompts Affect Latency Data?
Prompts can reduce latency by changing the antecedent or adding assistance. Record prompt level and decide whether prompted responses are included in the primary latency measure. If the goal is independent responding, a lower prompted latency does not prove independent mastery. Plot or annotate prompt conditions so the team can see whether latency remains low as prompts are faded.
What Latency-Graph Mistakes Appear on the BCBA Exam?
- Using response duration as latency: identify whether the clock ends at onset or offset.
- Calling no response zero: no response needs a planned rule, not a convenient number.
- Ignoring prompt level: a prompted response is not the same evidence as an independent response.
- Changing the antecedent: a shorter instruction or extra cue can change latency even if the intervention did not.
- Reading a lower line as automatically better: decide whether rapid responding is the actual goal and consider accuracy and safety.
- Using one outlier to claim a trend: examine repeated opportunities and phase-level patterns.
When Is Latency the Right Measurement?
Latency is a good choice when speed of initiation matters: following a safety instruction, beginning a communication response, transitioning after a cue, or initiating a daily-living step. It is not the best primary measure when the goal concerns how long an activity continues or how many times a response occurs.
Use the measure that matches the decision. If the team wants a learner to begin brushing teeth within 10 seconds, latency aligns with the goal. If the goal is to brush for two minutes, duration is more direct. If the goal is five independent requests per hour, rate or frequency may be appropriate.
What Is the Bottom Line?
A latency graph ABA workflow makes the timing rule visible: define the cue, define response onset, select a session summary, label the time unit, mark phase changes, and interpret the pattern with prompt and context data. For more practice with measurement distinctions, use the free BCBA mock exam. It supports study, but individualized assessment and supervision remain essential.
For targeted review, use our latency graph ABA practice questions to apply the concept in exam-style scenarios.
Quick Review Checklist
Use this final checklist to turn latency graph ABA into exam-ready reasoning. The goal is not to memorize a label in isolation; it is to identify the relevant evidence and explain why the best answer fits the scenario. Key ideas to review:
- State the central definition or decision point for latency graph ABA in your own words.
- Identify the detail that makes latency graph ABA different from its closest related ABA term.
- Separate the observable facts in a scenario from assumptions that are not supported by the facts.
- Write one example and one nonexample so you can recognize the concept in a new setting.
Exam application checks:
- Ask what the question is actually requesting before comparing the answer choices.
- Mark the antecedent, response, consequence, or other evidence that supports the selected answer.
- Look for a distractor that describes a related process but does not answer the specific question.
Final self-check:
- Explain how you would verify the interpretation with clear observations or data.
- Change one detail in the scenario and decide whether your answer should change.
- Give a one-sentence rationale that a supervisor or study partner could evaluate.
Take the Free BCBA Mock Exam
When you are ready to apply the idea, use the free practice resource below for additional feedback. Take the Free BCBA Mock Exam