
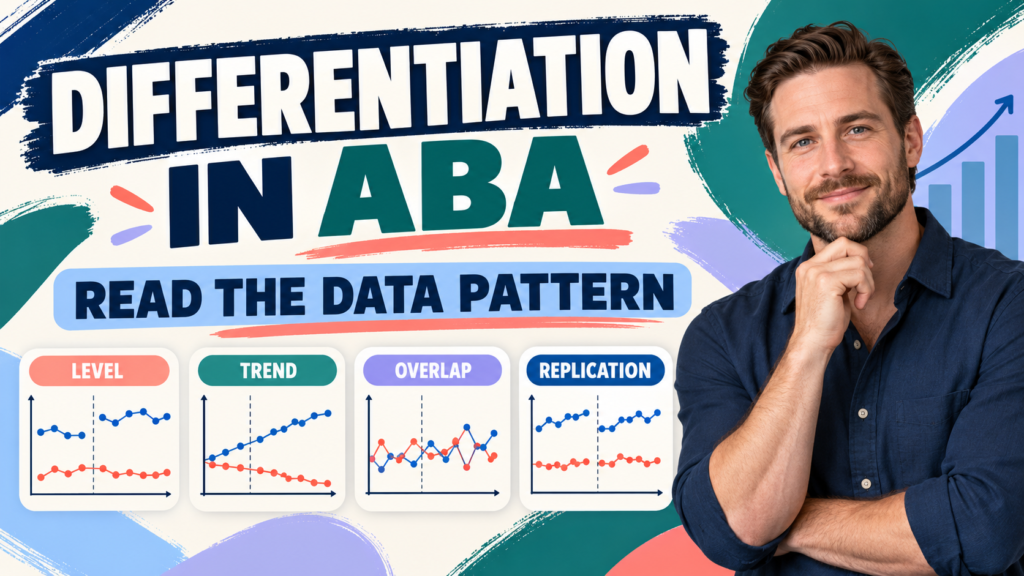
Differentiation in ABA means that graphed data show a clear, interpretable separation between conditions, phases, or response patterns. In a functional analysis, one test condition may consistently sit above a control condition; in an intervention analysis, behavior may change when the intervention begins and replicate when the design calls for it. A single unusual data point is not enough.
Table of Contents
- What Does Differentiation in ABA Mean?
- How Do You See Differentiation on a Graph?
- Why Does Differentiation Matter in Functional Analysis?
- How Is Data Differentiation Different from Discrimination?
- What Makes Differentiation Strong or Weak?
- What If the Data Are Not Differentiated?
- How Should You Use Visual Analysis?
- What Are the BCBA Exam Traps?
- Differentiation in ABA FAQ
- Take the Free BCBA Mock Exam
The word can be confusing because ABA also uses response differentiation and stimulus discrimination. This guide focuses on differentiation as a data-interpretation concept: how a BCBA candidate reads level, trend, variability, overlap, stability, and replication before deciding whether a graph shows a meaningful effect.
This is an educational BCBA study guide, not an instruction to conduct a functional analysis or change a real treatment plan. Assessment and intervention decisions require qualified supervision, individualized measurement, safety planning, and professional judgment. Table of Contents
What Does Differentiation in ABA Mean?
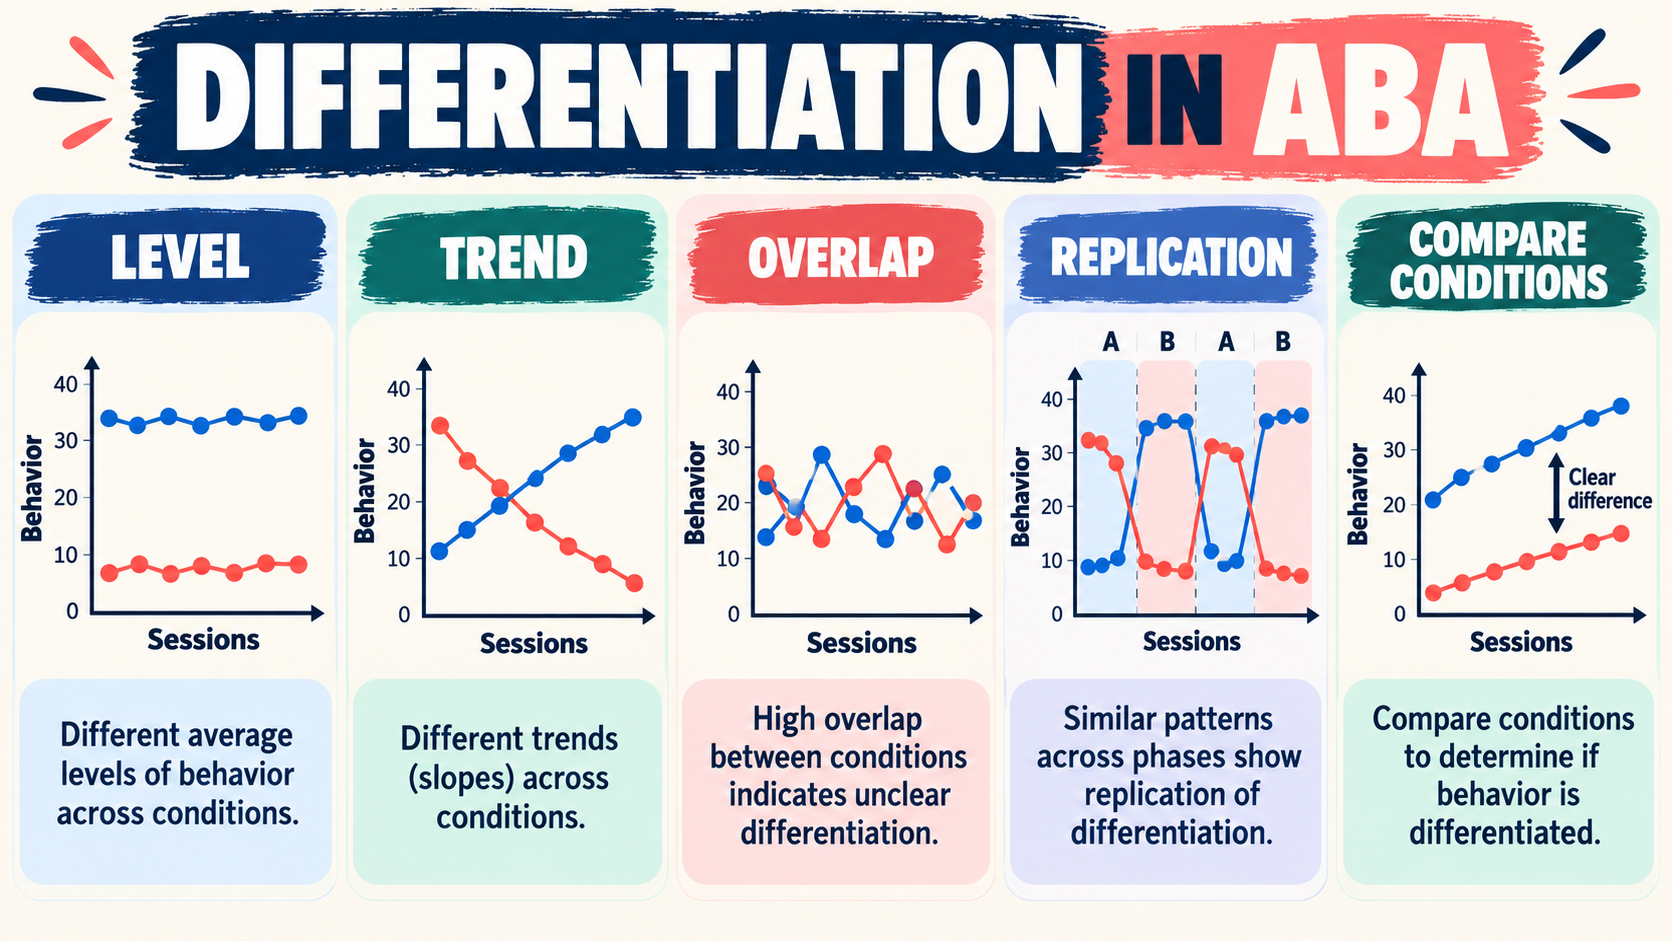
In data analysis, differentiation in ABA is a clear difference between data paths that correspond to different conditions or phases. The difference should be large enough, consistent enough, and interpretable enough to support the question being asked. Analysts usually inspect the graph rather than relying on a single score or an arbitrary cutoff.
For example, imagine a multielement functional-analysis graph with attention, demand, tangible, and play conditions. If the target behavior is repeatedly high in the demand condition and low in play, the paths may be differentiated. If all four conditions overlap heavily or move together, the graph is undifferentiated. The visual pattern does not automatically tell you what treatment to use, but it changes how confidently you can interpret the tested relation.
Differentiation can also refer to separation between baseline and intervention data. A level change immediately after a phase change, a stable pattern in one phase, and replication across a single-case design can support an experimental interpretation. The exact design, response dimension, and decision rule still matter. A useful definition for exam study is:
Differentiation is a clear, repeated separation in the measured data that corresponds to the condition or phase being compared.
That definition has three safeguards. The difference must be visible in the measured response, it must be connected to the comparison being made, and it should be evaluated across more than one opportunity whenever the design allows.
How Do You See Differentiation on a Graph?
Start with the graph’s labels before interpreting the lines. Check the x-axis, y-axis, phase or condition legend, response measure, and phase-change lines. A graph can look dramatic while hiding a change in the measurement system, observation length, or condition sequence. Then ask five questions, using the same sequence each time so that a striking line does not substitute for a careful comparison:
- Is there a level difference? Do the data in one condition sit consistently higher or lower than the comparison condition?
- Is there a trend difference? Do the paths move in different directions, or are both conditions rising and falling together?
- How much overlap is present? If the ranges are almost identical, the apparent separation may be weak.
- How stable are the paths? High variability can make a gap look larger or smaller than it really is.
- Does the pattern replicate? A repeated separation is more persuasive than one isolated spike or dip.
Use the response dimension that the graph actually displays. If the y-axis shows rate, do not describe it as duration. If the graph shows percentage of opportunities, do not infer that the learner completed a fixed number of trials without checking the denominator. Differentiation is only as meaningful as the measurement behind it.
Why Does Differentiation Matter in Functional Analysis?
Functional analysis is designed to test whether arranging different environmental events produces different levels of a target response. Differentiation is the graph-level pattern that can support a functional relation. For example, data that are consistently higher in an attention test condition than in the control condition may support an attention-maintained hypothesis, while an undifferentiated graph does not clearly identify one tested function. The BACB Test Content Outline places graph interpretation, quantitative relations, single-case designs, and behavior assessment within the exam framework.
Research on functional-analysis interpretation commonly describes visual inspection in terms of level, trend, variability, stability, and magnitude of effect. A large clinical case series also reported that analysts modified analyses when initial data did not differentiate, rather than treating every unclear graph as a confirmed function. The lesson for an exam candidate is not to memorize one universal criterion; it is to recognize the logic of repeated, condition-related separation and cautious interpretation.
Differentiation does not mean the target behavior has been “fixed.” It is evidence about the relation tested in the assessment. A treatment plan still needs a socially meaningful goal, a valid measurement system, an appropriate replacement or adaptive skill when a target is decreased, and ongoing evaluation.
How Is Data Differentiation Different from Discrimination?
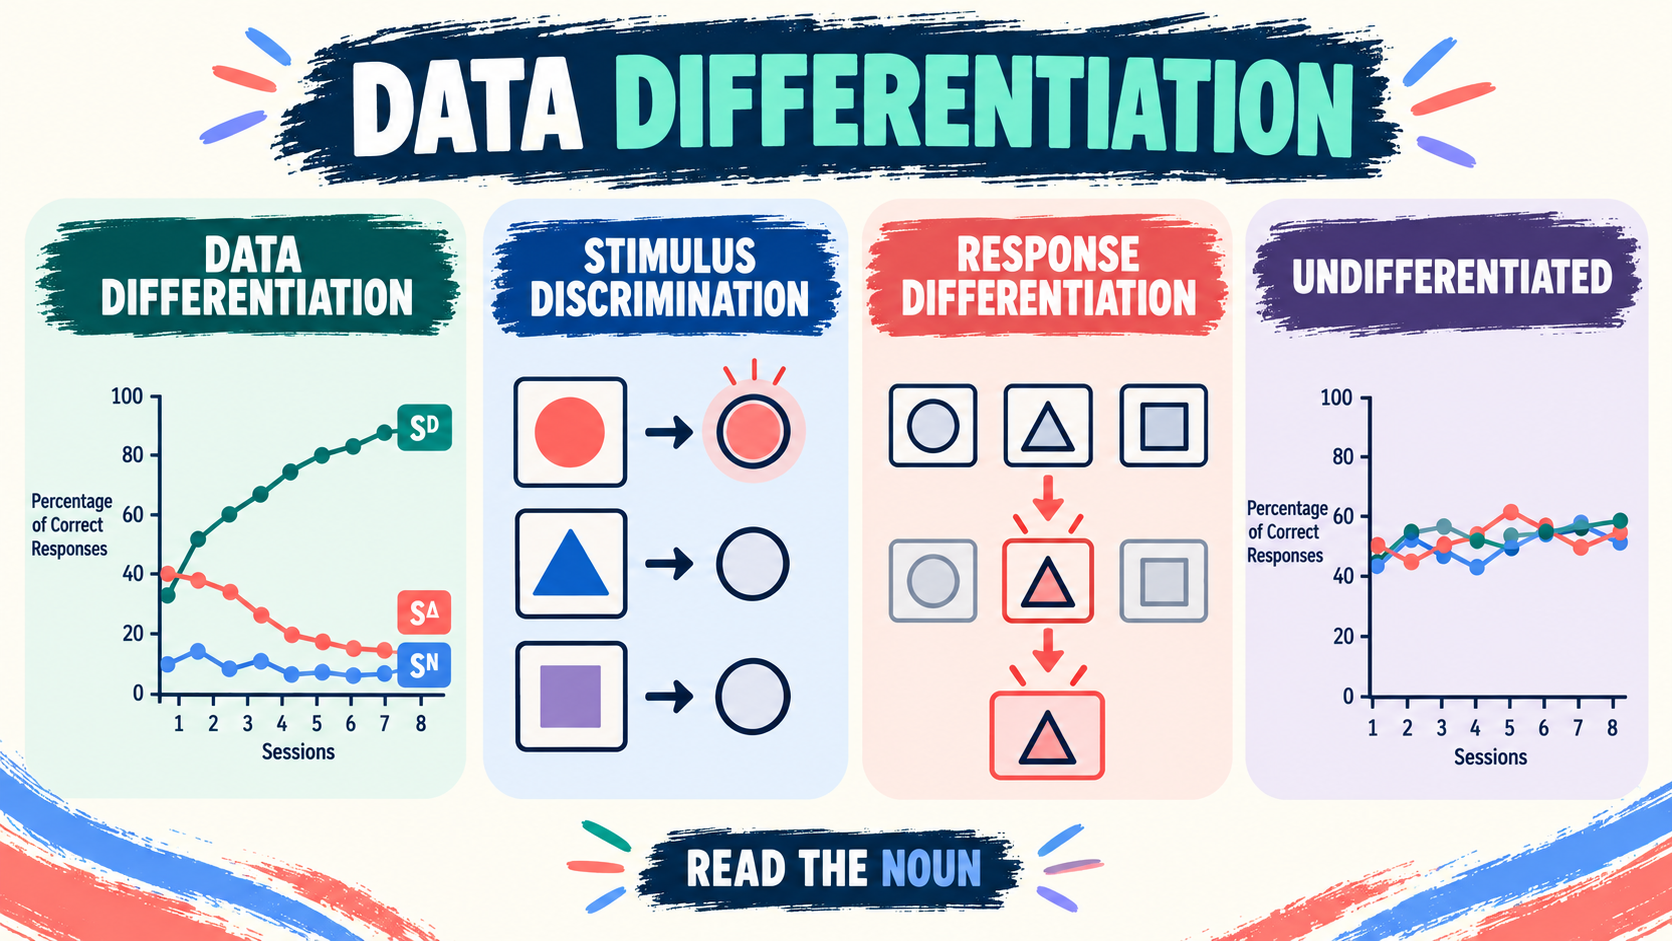
These terms share a word family but describe different levels of analysis. The comparison below keeps graph patterns, stimulus control, and response shaping separate, because the noun that follows “differentiation” changes the task a BCBA candidate must solve.
| Term | What is being compared? | Exam clue |
|---|---|---|
| Data differentiation | Data paths across conditions or phases. | Look for separation, stability, overlap, trend, and replication on a graph. |
| Stimulus discrimination | Behavior across stimuli or contexts. | A response occurs in the presence of one stimulus and not another because of a reinforcement history. |
| Response differentiation | Variations or dimensions of a response class. | Successive approximations or selected response forms become more likely through differential reinforcement. |
| Undifferentiated data | Paths that do not show a reliable condition-related separation. | Do not force a function or treatment conclusion from a graph that remains unclear. |
When a question says “the data are differentiated,” it is usually asking you to interpret the graph. When it says “the learner discriminates,” it is usually asking how behavior changes across stimuli or stimulus classes. Read the noun that follows the word.
What Makes Differentiation Strong or Weak?
There is no single visual feature that decides every graph. Strong differentiation often combines a clear level or trend separation, limited overlap, reasonable within-condition stability, and replication. Weak differentiation can show a small average difference that is buried by variability, a separation that appears only at the end of one phase, or a difference that disappears when the condition is repeated.
Use the following checklist when studying, and treat each item as a prompt for describing the graph before naming an interpretation. This sequence helps separate what the data show from what the analyst infers about a possible behavioral relation:
- Magnitude: Is the difference large enough to matter for the referral question?
- Consistency: Does the pattern appear across sessions rather than only once?
- Stability: Are the data sufficiently stable to make the comparison interpretable?
- Overlap: Do the ranges of the paths occupy the same space?
- Timing: Does the change occur when the condition or phase changes?
- Replication: Does the design repeat the comparison or demonstrate it at another point?
Do not turn the checklist into a rigid scoring formula unless the question gives you one. A graph with some overlap can still show a useful relation, while a graph with a large difference can be misleading if the measurement or condition changed unexpectedly.
What If the Data Are Not Differentiated?
Undifferentiated data are information, not a reason to blame the learner or announce that assessment “failed.” Several explanations are possible: the tested variables may not match the maintaining contingency, the conditions may not be sufficiently distinct, the response definition may be unclear, the measure may be insensitive, the sessions may be too short, or the behavior may be influenced by more than one variable.
- Verify the measure: confirm the operational definition, response dimension, denominator, and observation period.
- Verify the comparison: check that condition labels, phase changes, and control data are interpreted correctly.
- Verify the procedure: review procedural integrity and context before treating a flat or overlapping graph as a final answer.
A qualified analyst may review the data-collection system, examine procedural integrity, consult relevant records and stakeholders, and consider an individualized modification to the assessment design. The decision should be based on risk, feasibility, client context, and the question the assessment must answer. Do not casually intensify a demand, withhold a needed support, or conduct a functional analysis as a do-it-yourself exercise.
For exam reasoning, the safest response is usually to acknowledge the uncertainty and gather or evaluate better evidence. An undifferentiated graph may call for continued assessment, a modified analysis, additional descriptive information, or a different measurement strategy. It does not justify selecting the most familiar function simply because the target behavior “looks like” escape or attention.
How Should You Use Visual Analysis?
The BACB Test Content Outline includes graphing and interpreting quantitative relations, interpreting data from single-case designs, and evaluating assessment and intervention evidence. Visual analysis is therefore a core study skill. It is also a judgment skill that can be affected by training, graph construction, expectations, and the complexity of the data. A systematic visual-analysis routine can improve consistency by making the order of interpretation explicit. It also gives a study partner or supervisor a common language for checking whether a conclusion goes beyond the graph:
- Read the labels and confirm the dependent measure.
- Identify the phase or condition changes before looking for a conclusion.
- Describe level, trend, variability, and overlap without naming a function yet.
- Compare the pattern with the control, baseline, or relevant alternative.
- Check whether the difference replicates and whether procedural integrity supports interpretation.
- State the narrowest conclusion supported by the graph and name what remains uncertain.
Research has found that visual judgments of functional-analysis graphs are not perfectly reliable, including among experienced analysts. That finding does not make graphs useless; it explains why training, clear graphing conventions, decision aids, and careful consultation matter. On an exam, it is a reason to avoid absolute answers based on one data point.
What Are the BCBA Exam Traps?
Use these distinctions when a question includes the phrase differentiation in ABA. The wording matters because a test item may shift from graph interpretation to stimulus control or response shaping without announcing the change:
- Do not equate difference with differentiation. A numerical difference may be too small, unstable, or unreplicated to support the conclusion.
- Do not confuse differentiation with discrimination. One describes a data pattern; the other describes behavior controlled by stimuli.
- Do not infer function from topography. Aggression, refusal, or screaming can occur under different contingencies.
- Do not ignore the y-axis. A higher rate may be improvement for a skill and a problem for a target behavior.
- Do not treat undifferentiated data as a confirmed automatic function. Similar responding across conditions means the tested conditions did not separate clearly; it does not name every possible automatic process.
- Do not choose a treatment before reading the evidence. First decide what relation the graph supports and what additional information is required.
The best answer usually uses measured language: “the data show a differentiated pattern consistent with the tested condition,” not “this behavior always has that function.”
Differentiation in ABA FAQ
What is differentiation in ABA in one sentence?: Differentiation is a clear, repeated separation between data paths that correspond to different conditions or phases. What does a differentiated functional analysis graph show?: It shows that responding is reliably different in at least one test condition compared with the relevant control or comparison condition, based on the graph’s level, trend, variability, overlap, stability, and replication. Is differentiation the same as discrimination?: No. Data differentiation is a graph-interpretation concept. Stimulus discrimination describes a response pattern across stimuli or contexts based on reinforcement history.
What does undifferentiated data mean?: It means the displayed conditions or phases do not show a sufficiently clear relation for the question being asked. The analyst should examine measurement, integrity, design, and alternative explanations before drawing a conclusion.
Can one high data point prove differentiation?: No. One high or low point may reflect variability, an unusual event, or measurement error. Look for a pattern that is repeated and tied to the condition or phase change.
For additional graph-reading practice, use the free differentiation in ABA BCBA mock exam as a study checkpoint. It is independent study support, not official BACB material and not a substitute for qualified assessment or supervision.
The practical takeaway is simple: define the measure, read the graph before the label, inspect level and trend, account for variability and overlap, look for replication, and state only what the data support. That is the exam-ready meaning of differentiation in ABA.
Take the Free BCBA Mock Exam
If you want a low-pressure way to check your recall, use the free practice resource below. Take the Free BCBA Mock Exam



