

In applied behavior analysis (ABA), precise measurement is essential for evaluating behavior change and making data-based decisions. While direct observation often focuses on fundamental measures such as frequency or duration, behavior analysts frequently need to compare performance across different contexts. That is where derivative measures in ABA come in. This guide defines derivative measures, distinguishes them from fundamental measures, provides worked examples, and explains their practical use and limitations in clinical and educational settings. Whether you are studying for the BCBA exam or refreshing your professional skills, understanding derivative measures is crucial for accurate data analysis and interpretation. Table of Contents
Table of Contents
- What Are Derivative Measures in ABA?
- Derivative Measures vs. Fundamental Measures
- How to Calculate Derivative Measures: Examples and Formulas
- Practical Applications in Clinical and Educational Settings
- Limitations and Common Traps of Derivative Measures
- Practical Tips for Using Derivative Measures in ABA
- Study Checklist for the BCBA Exam
- Conclusion
- Reference
What Are Derivative Measures in ABA?
Derivative measures in ABA are values calculated from one or more fundamental measures, such as frequency, duration, or latency, rather than directly observed and recorded. For example, percentage is a derivative measure because it is computed from the frequency of correct responses and the total number of trials. Similarly, trials-to-criterion is derived from the number of trials required to reach a mastery standard. These measures are used to standardize raw data, allowing behavior analysts to compare performance across sessions, clients, or interventions. The BACB’s BCBA Test Content Outline (6th ed.) emphasizes measurement as a core competency, so knowing how to compute and interpret derivative measures is a valuable skill.
Unlike fundamental measures, which capture raw counts or durations, derivative measures require a mathematical operation. For instance, rate (responses per minute) is derived from frequency and time, while percentage is derived from a ratio. In practice, these calculations help answer questions like “Did the client improve?” or “Is the intervention working?” without being misled by varying baseline conditions.
Derivative Measures vs. Fundamental Measures
To understand derivative measures, it is helpful to compare them with fundamental measures. Fundamental measures include frequency (count), duration (total time), latency (time from stimulus to response), and intensity (magnitude). These are directly observed and recorded. Derivative measures, on the other hand, are always computed from multiple data points. For example, percentage of correct responses requires both correct count and total count, making it a ratio. Other common derivative measures include trials-to-criterion (the number of trials to meet a set standard) and duration per occurrence (average duration). The key distinction is that derivative measures are not independent raw data; they are transformations.
Why use derivatives? They offer standardization. For instance, saying a client gave 10 correct answers does not convey performance if the total trials were 10 versus 100. Percentage (100% vs. 10%) provides a clearer picture. Similarly, rate (responses per minute) allows comparisons when observation durations differ. In clinical settings, derivatives enable behavior analysts to set consistent mastery criteria—like 80% accuracy across two sessions—which would be difficult with raw counts alone.
How to Calculate Derivative Measures: Examples and Formulas
Percentage of Correct Responses: The most common derivative measure is percentage. The formula is: (Number of correct responses ÷ Total number of trials) × 100 = Percentage. Worked example: During a discrete-trial teaching session, a client had 12 correct responses out of 15 total trials. Divide 12 by 15 to get 0.8, then multiply by 100 to obtain 80%. This percentage standardizes the result, allowing quick comparison with other sessions. Practically, if the mastery criterion is 80% accuracy, this client met the goal. However, a percentage alone does not tell you whether the change was due to more correct responses or fewer trials, a point we will revisit.
Trials-to-Criterion: Trials-to-criterion is a derivative measure that indicates how many teaching trials were needed to reach a predefined mastery level. For example, if a learner meets the 90% criterion on the 25th trial, the trials-to-criterion is 25. This measure is useful for comparing the efficiency of different interventions. It is derived from frequency data but is not a simple count—it is a count of trials up to a behavioral milestone.
Duration per Occurrence: Duration per occurrence (average duration) is derived by dividing total duration by the frequency of the behavior. For instance, if a child engaged in tantrum behavior for a total of 30 minutes across 5 instances, the average duration per occurrence is 6 minutes (30 minutes ÷ 5). This provides a meaningful summary of behavior intensity, but again, it relies on both measures.
Practical Applications in Clinical and Educational Settings
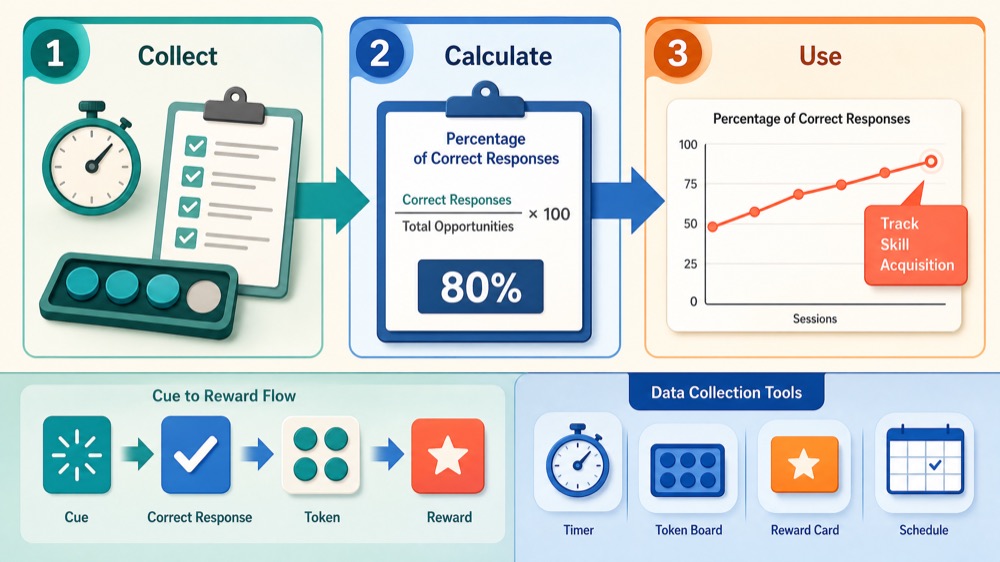
Derivative measures are used daily in ABA to make data-driven decisions. In early intervention, percentage of correct responses is a standard way to track skill acquisition. For example, during a receptive identification program, a therapist might record 8 correct out of 10 trials (80%). In a school setting, rate of on-task behavior (measured as responses per minute) can indicate engagement. In behavior reduction, duration per occurrence can help assess the severity of a behavior. These measures are especially valuable when comparing behavior across different times or conditions.
- Example 1: A behavior analyst sets a mastery criterion of 80% correct across two consecutive sessions. This percentage is a derivative measure, as it is computed from correct responses and total trials.
- Example 2: In a language intervention, trials-to-criterion is used to compare the efficiency of two teaching methods. If Method A requires 30 trials and Method B requires 20, the analyst can choose the more efficient method.
- Example 3: For task analysis, percentage of steps completed correctly (e.g., 8 out of 10 steps = 80%) provides a summary of skill proficiency.
When interpreting derivative measures, consider the denominator. A percentage based on a single trial (1 out of 1) is not very meaningful. Always look at the raw counts behind the percentage to avoid misinterpretation. For example, an 80% score from 4 out of 5 trials is less reliable than 80% from 80 out of 100 trials.
Limitations and Common Traps of Derivative Measures
While derivative measures are powerful, they have limitations that can lead to misinterpretation. A critical one is that they can obscure absolute changes. For instance, a change from 80% to 90% might be due to an increase in correct responses, but it could also result from a decrease in total trials. Suppose Session 1 had 8 correct out of 10 (80%) and Session 2 had 9 correct out of 10 (90%). That is a genuine improvement. However, if Session 1 had 8 correct out of 10 (80%) and Session 2 had 9 correct out of 10 (90%), but in Session 2 the total trials were only 10 instead of 12, the percentage change masks the fact that the absolute increase in correct responses was small. More concerning, if Session 1 had 8 correct out of 10 (80%) and Session 2 had 9 correct out of 10 (90%), but in Session 2 the denominator dropped from 12 to 10, the percentage increased even though the raw correct count went from 9 to 9—no change. Thus, always pair percentages with raw data.
Another limitation is that derivative measures are not directly observed; they are calculated. As such, they are not raw data. Relying solely on a percentage can hide variability. For example, a client might score 80% across five sessions, but the pattern of correct responses could be inconsistent, which a percentage alone will not reveal. Also, low denominators can make a percentage misleading: 1 out of 1 equals 100%, which may overstate competence. In clinical decisions, use derivative measures as summaries but always review the underlying fundamental measures.
- Common trap 1: Assuming a percentage increase always means behavior improvement. Always check the denominator.
- Common trap 2: Using percentage with very few trials (e.g., 1 out of 1) to make important decisions. Set a minimum trial count for reliable data.
- Common trap 3: Forgetting that derivative measures are not directly observed; they are mathematically derived, so they carry no more information than the underlying data.
Do not fall for the misconception that derivative measures are inherently more accurate than fundamental measures. Accuracy depends on the quality of the raw data, not the transformation. A percentage calculated from poorly recorded frequencies is still unreliable.
Practical Tips for Using Derivative Measures in ABA
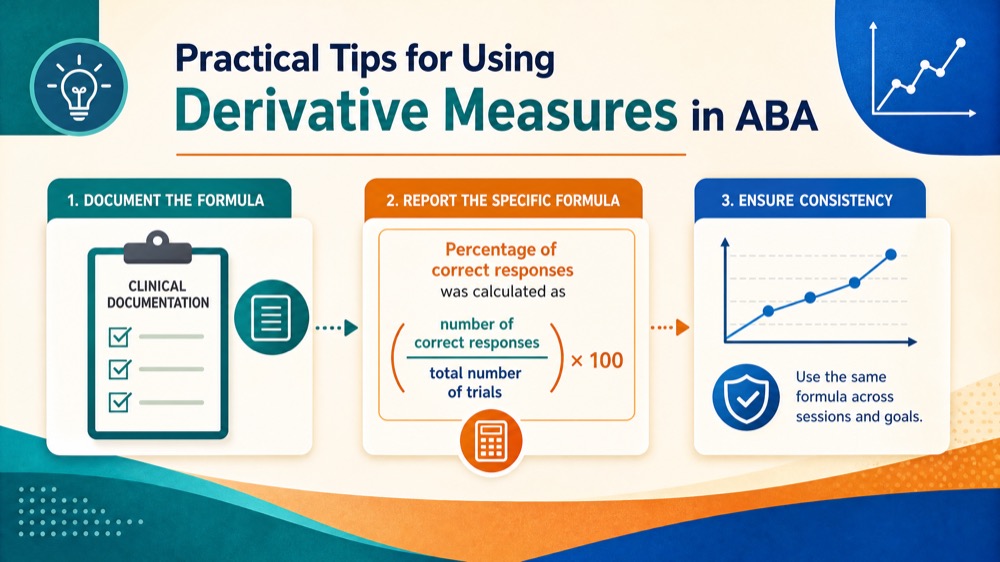
To use derivative measures effectively, keep these tips in mind:
- Always record the raw data: Derivative measures are only as good as the fundamental measures they are based on. Ensure accurate counting and timing.
- Specify the denominator: When reporting a percentage, include the number of trials (e.g., 80% (8/10)). This gives context and helps interpretation.
- Choose the right derivative: Different measures answer different questions. Use percentage for accuracy, rate for fluency, trials-to-criterion for efficiency.
- Be cautious with low denominators: If a client only has a few trials, a percentage can be unstable. Collect more data before making decisions.
In clinical documentation, always report the specific formula used. For example, “Percentage of correct responses was calculated as (number of correct responses / total number of trials) × 100.” This transparency is consistent with the BACB’s Ethics Code requirement for accurate data reporting.
Study Checklist for the BCBA Exam
To master derivative measures for the BCBA exam, review these concepts:
- Define derivative measures and distinguish them from fundamental measures.
- Calculate percentage, trials-to-criterion, and duration per occurrence from sample data.
- Explain why derivative measures are used (standardization, comparison).
- Interpret a percentage in context, checking the denominator.
- Identify limitations of derivative measures (e.g., obscuring absolute changes).
Remember that the BACB’s BCBA Test Content Outline (6th ed.) includes measurement as part of the task list, but that does not guarantee this specific topic appears on your exam. Use this checklist as part of a broader study plan. For practice, try our free BCBA mock exam to get feedback on your understanding of measurement concepts.
Conclusion
Derivative measures in ABA are essential tools for summing up and comparing behavior. They are not directly observed but are calculated from fundamental measures like frequency and duration. Understanding how to compute and interpret them—while being aware of their limitations—is crucial for effective behavior analysis. By mastering percentage, trials-to-criterion, and other derivatives, you will be better equipped to make data-based decisions and excel in your BCBA exam preparation. Always pair derivative data with raw counts to avoid misinterpretation, and remember that a single percentage cannot capture the full story.
If you are preparing for the BCBA exam, our free BCBA mock exam offers a range of practice questions and feedback to help you assess your readiness. It will not contain this exact article’s topic, but it will help you build the measurement skills you need.
Reference
Next step for BCBA exam prep
Turn this topic into exam-day practice
Use this topic as a focused review, then test it in exam-style conditions with a free mock before deciding whether five full-length mocks are the right next step.
Start the Free BCBA Mock ExamContinue with Five Full-Length Mocks — $99
Review the included materials and access details before ordering. No pass guarantee is implied.



