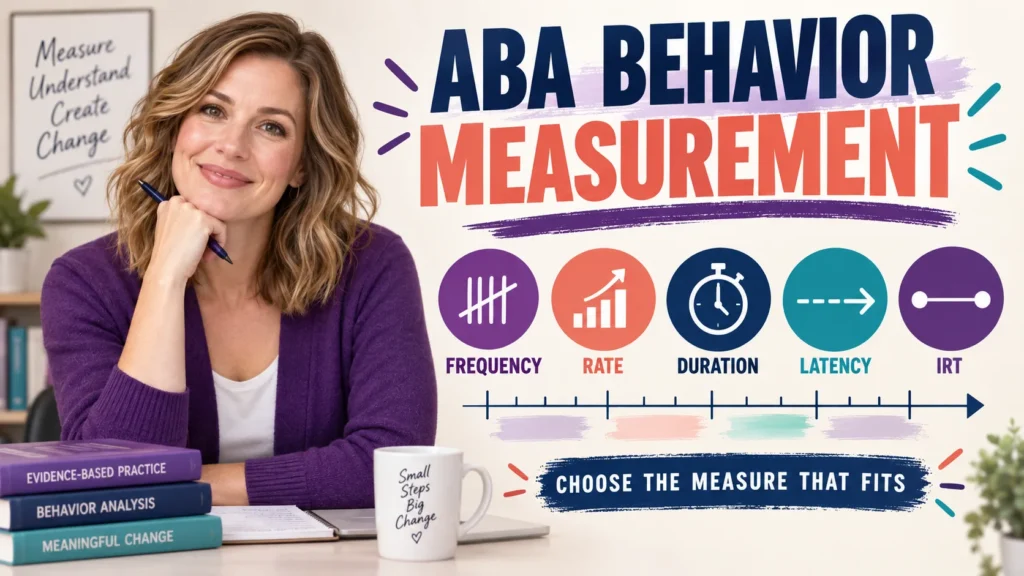
If you searched for the duration rate frequency etc of behavior, you are probably looking for a practical way to decide what to measure—not a list of disconnected definitions. In ABA, the useful question is which observable dimension will answer the decision in front of you: how often a response occurs, how long it lasts, how quickly it starts, or how much time separates responses.
Table of Contents
- The duration rate frequency etc of behavior: direct answer
- Choose the behavior dimension before the procedure
- Frequency and rate: count versus count per time
- Duration: how long the behavior lasts
- Latency and IRT: timing around the response
- A reliable measurement workflow
- Data quality, graphs, and interpretation
- Common measurement mistakes
- Exam-style application examples
- FAQ
- Sources for further study
This guide treats the phrase as an umbrella measurement task. It explains frequency, rate, duration, latency, interresponse time (IRT), percentage, and interval-based procedures; shows how to match the measure to the behavior; and gives a repeatable workflow for recording, calculating, graphing, and reviewing data. It is educational study material, not an individualized assessment or treatment plan.
The BACB BCBA Test Content Outline places measurement, data display, visual analysis, and data-based decisions inside the behavior-analytic task set. Peer-reviewed measurement discussions such as Johnston and Hodge’s analysis of count and time ratios also show why the denominator and observation window matter. Use current official guidance and supervision when applying any measurement system with a client. Table of Contents
The duration rate frequency etc of behavior: direct answer
The phrase refers to the measurable dimensions of behavior and the related procedures used to describe them. A count answers “how many?” A rate answers “how many per unit of time?” Duration answers “how long?” Latency answers “how long until the response starts?” IRT answers “how much time passes between responses?” Percentage and interval procedures answer opportunity- or time-sampling questions rather than simply counting every event.
| Dimension | Question answered | Simple example | Watch the denominator |
|---|---|---|---|
| Frequency / count | How many times did the response occur? | 8 requests during one 20-minute observation | A raw count is hard to compare when observation lengths differ. |
| Rate | How many responses occurred per unit of time? | 8 responses ÷ 20 minutes = 0.4 responses per minute | State the unit and make sure exposure time is known. |
| Duration | How long did one episode or period last? | A vocal episode lasted 90 seconds | Define onset and offset consistently. |
| Latency | How long from the cue to response onset? | The learner began the task 12 seconds after the instruction. | Identify the exact cue and the response start. |
| IRT | How much time separates two responses? | 25 seconds between two episodes | Clarify which response marks each endpoint. |
| Percentage | What proportion of opportunities or trials met the definition? | 6 independent responses ÷ 10 opportunities = 60% | The number and type of opportunities must be comparable. |
These dimensions are not interchangeable labels. A behavior can have a high count but a short duration, or a low count with very long episodes. Select the dimension that preserves the feature that matters to the learner, caregiver, supervisor, or clinical decision.
Choose the behavior dimension before the procedure
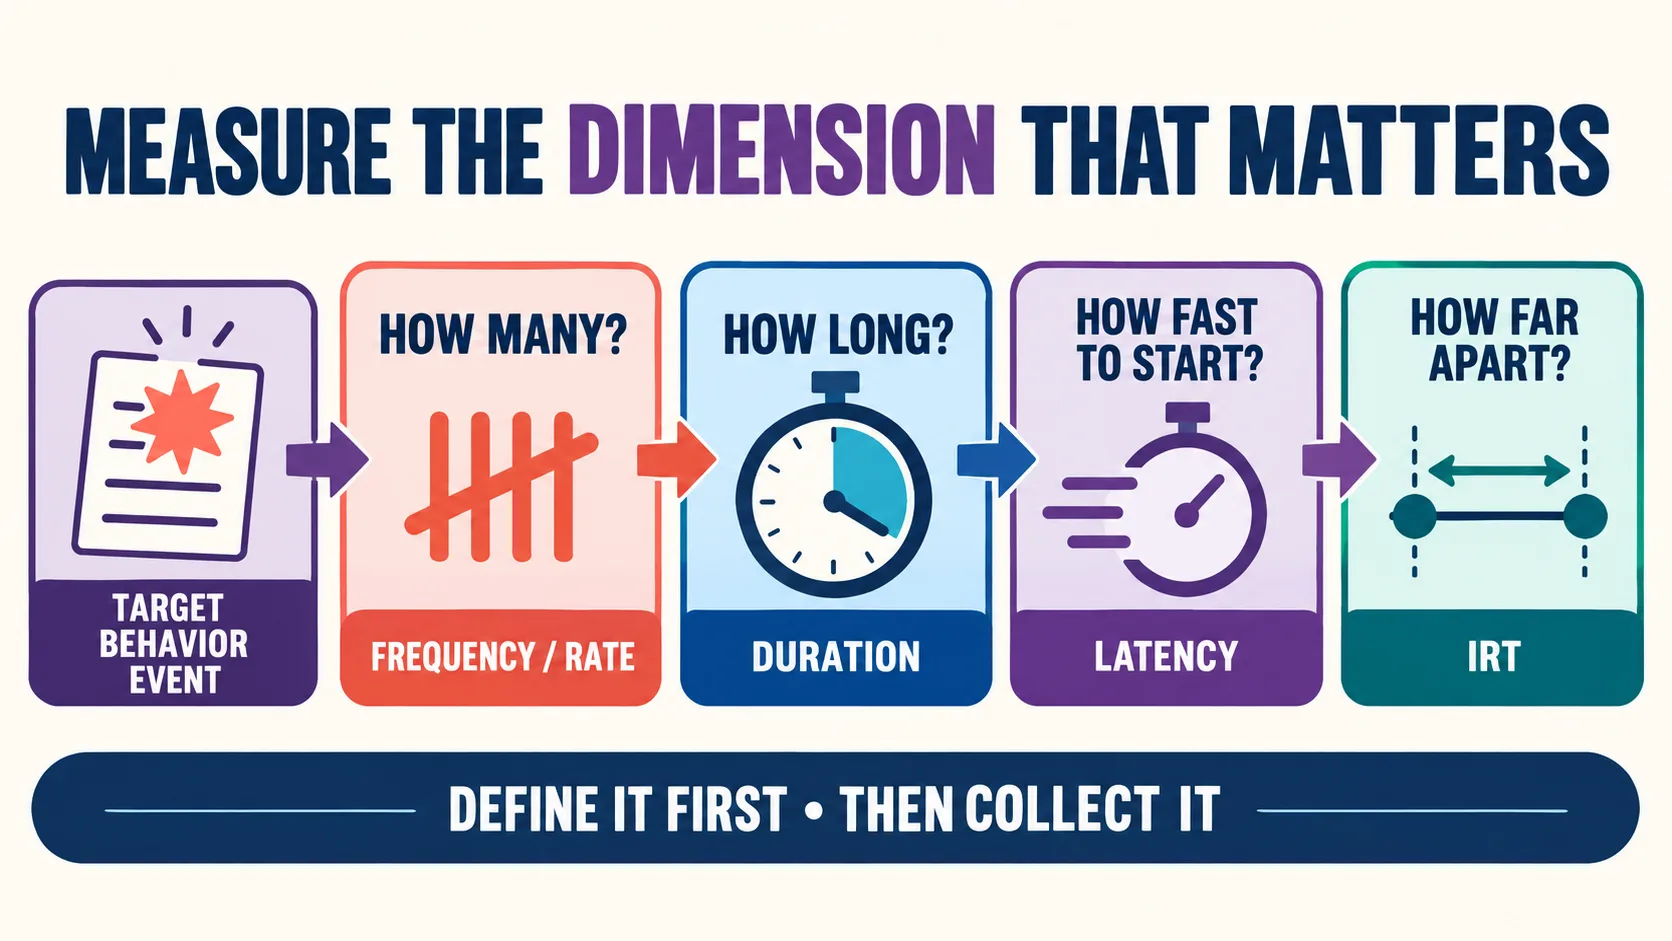
Start with an operational definition that a trained observer could apply. Define the response topography, the start point, the stop point, and what does not count. Then ask what change would be meaningful. If the concern is repeated interruptions, count or rate may fit. If the concern is sustained engagement, duration may be more informative. If the concern is delayed task initiation, latency may be the critical dimension. Use this decision sequence:
- Describe the response: write what an observer can see or hear, not an inferred state such as “noncompliance” or “anxiety.”
- Identify the question: is the team asking about occurrence, persistence, speed, spacing, opportunity success, or change across time?
- Check feasibility: can the observer detect every response, time the episode accurately, or identify each opportunity in the actual setting?
- Choose the smallest useful system: avoid collecting several measures simply because they are available.
- Set a decision rule: decide what pattern would lead to continuing, adjusting, or reviewing the plan.
Procedure choice comes after the dimension. A continuous event-recording system may fit discrete responses that have clear beginnings and endings. Duration recording may fit an ongoing episode. Partial-interval, whole-interval, or momentary time-sampling procedures estimate behavior across intervals and can answer different questions than continuous measurement. The methodological review in Choosing measurement procedures for behavior is useful for understanding why the procedure must match the target and the decision.
Frequency and rate: count versus count per time
Frequency is the number of occurrences in an observation. If a learner makes 8 requests, the frequency is 8 for that observation. Rate standardizes the count by time. If those 8 requests occurred in 20 minutes, the rate is 0.4 requests per minute. A reader who wants the broad definitions can review the site’s frequency in ABA guide and rate in ABA guide; this page connects them to the larger measurement choice.
Rate becomes especially important when observation windows are unequal. Six responses in 10 minutes and six responses in 60 minutes have the same frequency but not the same rate. Write the observation window beside every count, and state whether the rate is per minute, hour, opportunity, or another unit. Do not compare “per session” data as though every session had the same exposure time.
Rate is not automatically better. If the target is a single prolonged episode, counting starts may hide the clinically important duration. If opportunities are deliberately structured, percentage of opportunities may be more interpretable than a time-based rate. The measure should follow the behavior and decision, not the preference of the spreadsheet.
Duration: how long the behavior lasts
Duration records the time from the defined onset of an episode to its defined offset. It can be reported as total duration, average duration per episode, or another clearly described summary. For example, if three episodes last 20, 40, and 60 seconds, the total is 120 seconds and the average is 40 seconds per episode. Both summaries can be accurate while answering different questions.
Duration requires crisp onset and offset rules. Does an episode begin with the first audible vocalization, after a specified pause, or only after a cluster threshold? Does it end after a defined period without the response? These choices should be written before data collection and applied consistently. See the site’s duration recording guide for a focused review of onset, offset, and exam distinctions.
Do not substitute duration for rate just because both involve time. Rate describes occurrence relative to an observation window; duration describes how long an episode occupies time. A person can have fewer episodes while each episode lasts longer. Looking at only one dimension could produce the wrong conclusion about improvement.
Latency and IRT: timing around the response
Latency is the time between an event such as an instruction and the start of the response. It is useful when initiation speed matters. Interresponse time is the time between the end or occurrence of one response and the next response, depending on the operational definition. It is useful when spacing matters, such as repetitive responses that occur too close together or a skill that should be distributed across a routine.
Keep the endpoints visible in the data sheet. If an instruction is repeated, decide whether the latency clock resets or whether the repeated cue is a new opportunity. If a response overlaps another response, specify how the IRT is calculated. The site’s temporal locus guide provides a deeper comparison of latency and IRT.
Timing measures often reveal a pattern that count alone misses. A learner may complete the same number of tasks but begin more quickly, or may make the same number of responses with longer spacing. Pair the timing measure with the functional goal and with safeguards against rushing or pressuring the learner.
A reliable measurement workflow
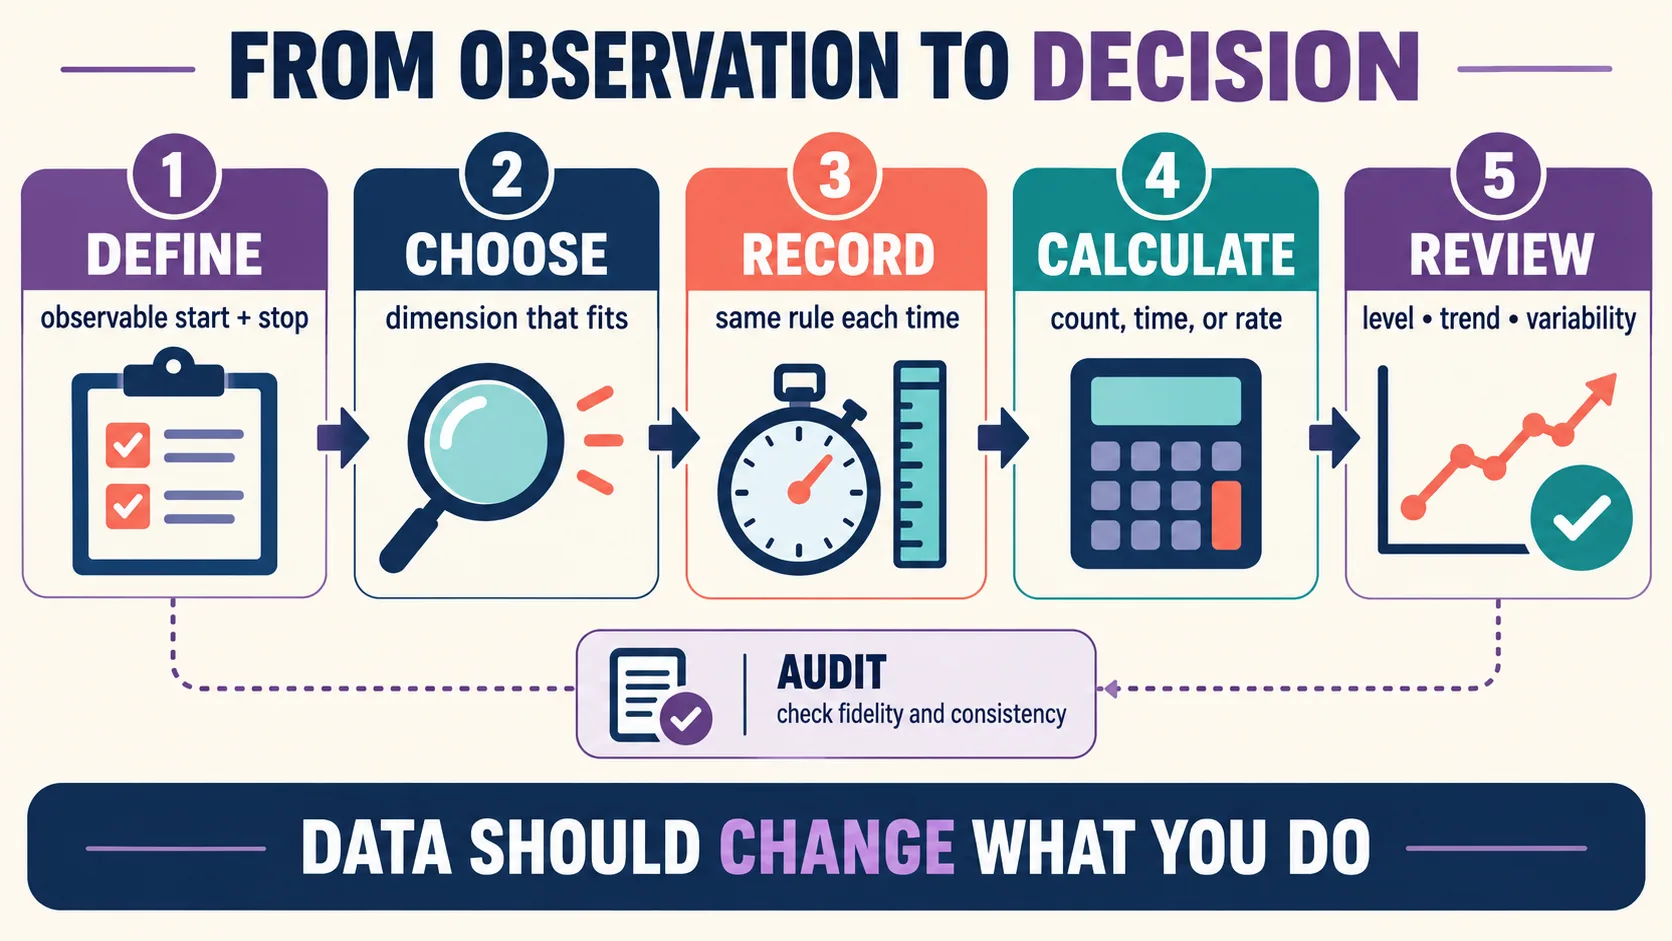
A defensible system is a chain from observation to decision:
- Define: write the observable response and the exact start and stop rules.
- Choose: select frequency, rate, duration, latency, IRT, percentage, or an interval method based on the critical dimension.
- Record: use the same prompt, opportunity, timing, and scoring rule as much as the setting allows.
- Calculate: preserve the unit. For rate, show the numerator and observation time; for percentage, show opportunities; for duration, show total versus average.
- Review: inspect level, trend, and variability and decide whether the data support the next action.
Before interpreting a change, ask whether the measurement conditions also changed. A shorter session, a different observer, a new prompt, a different number of opportunities, or a changed operational definition can make the data look different without demonstrating a behavior change. Record those context variables so the graph has a readable history.
Data quality, graphs, and interpretation
Good measurement is not just a complete column of numbers. Check whether the definition was usable, observers applied it consistently, and the data were displayed in a way that supports the decision. The current BACB outline connects data display and visual analysis to data-based decision-making, so practice reading a graph rather than memorizing a formula alone.
- Level: the typical value within a phase or condition.
- Trend: the direction of change across observations.
- Variability: how much the values move around rather than clustering.
- Phase or condition: what procedure, context, or intervention was in place.
- Context: changes in opportunity count, observation time, observer, setting, or implementation fidelity.
When possible, plan an observer-agreement or fidelity check that fits the system. A high agreement percentage cannot rescue an ambiguous definition, and a clean graph cannot prove that a procedure caused the change by itself. Use the result as one part of a supervised, ethical decision process.
Common measurement mistakes
- Calling every count a rate: a count has no time unit unless you calculate one.
- Comparing raw counts across unequal windows: preserve exposure time or use an appropriate standardized measure.
- Using duration for an event behavior: if the important feature is how often a brief response occurs, duration may obscure the question.
- Leaving onset and offset undefined: observers may record different episodes under the same label.
- Confusing latency with IRT: latency begins with a cue; IRT is the spacing between responses.
- Changing the definition midstream: document and review any operational change instead of treating the series as uninterrupted.
- Treating missing data as zero: “not observed,” “not applicable,” and zero behavior are different values.
- Collecting every possible measure: excess data can reduce fidelity and make the decision less clear.
Exam-style application examples
Example 1: unequal observation windows. A technician records 4 instances in a 10-minute observation and 6 instances in a 30-minute observation. The second count is larger, but the rates are 0.4 and 0.2 per minute. If the question asks which session had the higher occurrence relative to time, use rate—not raw frequency.
Example 2: prolonged episodes. A learner engages in one episode for 12 minutes and later has four episodes lasting 30 seconds each. Frequency alone suggests more behavior in the second observation; duration shows that the first observation occupied far more time. If time engaged is the concern, select duration and define the endpoints.
Example 3: delayed initiation. The learner eventually completes every task, but waits 45 seconds after an instruction. The number of completed tasks may look stable while latency changes. If the target is prompt initiation, measure the cue-to-response interval and state what counts as response onset.
When you are ready to practice choosing the correct dimension from new scenarios, use the Take the Free BCBA Mock Exam. It is a study checkpoint, not an official BACB result and not a substitute for supervision.
FAQ
What is the difference between frequency and rate in behavior measurement?: Frequency is the number of responses observed. Rate divides that count by a stated unit of time, such as responses per minute. Rate is useful when observation windows differ, but the unit and exposure time must be recorded.
When should I use duration instead of frequency?: Use duration when the amount of time an episode lasts is the important feature, such as sustained engagement or a prolonged behavior. Use frequency when the number of discrete occurrences is the central question. Some decisions need both.
Are latency and IRT the same?: No. Latency is the time from a defined cue or event to the start of a response. IRT is the time between defined responses. The start and end points must be written into the operational definition.
What should I do if the phrase “the duration rate frequency etc of behavior” appears on a study list?: Translate it into a measurement-selection question. Identify whether the scenario emphasizes count, time occupied, response speed, response spacing, opportunities, or interval sampling. Then check the denominator and the operational definition before choosing an answer.
Sources for further study
- Behavior Analyst Certification Board: BCBA Test Content Outline, 6th edition
- Johnston and Hodge: Describing behavior with ratios of count and time
- Choosing measurement procedures for behavior
- On Terms: Frequency and rate in applied behavior analysis
- Measurement methods in ABA: internal study guide
This article is for general education and BCBA exam-study context. It is not individualized clinical, medical, legal, or behavioral advice; it is not affiliated with or endorsed by the BACB; and it does not replace assessment, informed consent, assent, supervision, or a written behavior plan.