
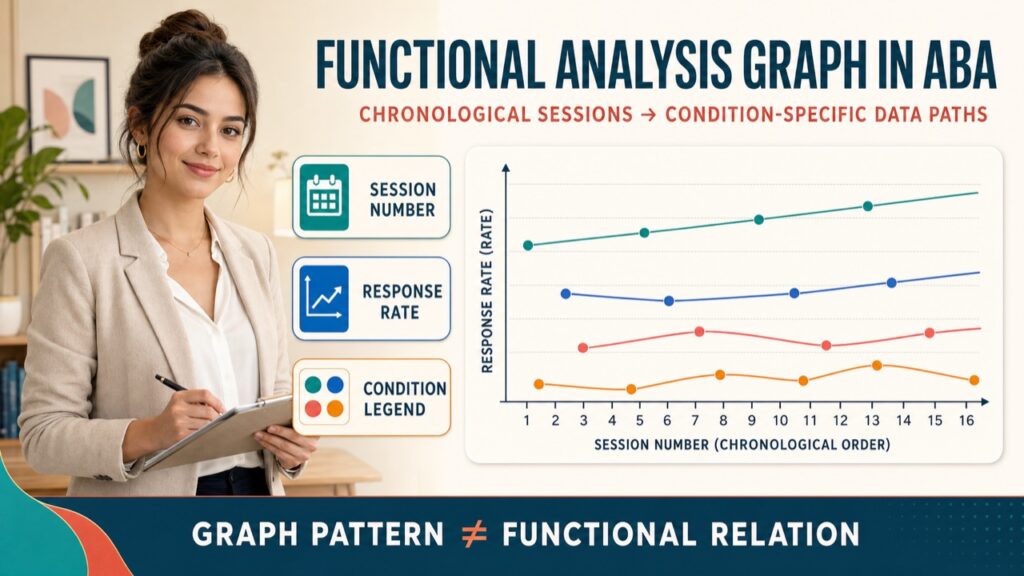
The functional analysis graph aba is the primary visual tool for identifying the variables that maintain challenging behavior. Unlike descriptive assessments that merely correlate behavior with environmental events, a functional analysis systematically manipulates test conditions to demonstrate a functional relation. This practical guide provides a complete graphing utility: a sample data table, the rate formula for variable session durations, a graph setup checklist, and a fully labeled hypothetical multielement display. You will also learn how to conduct cautious visual inspection of differentiation, level, trend, variability, overlap, and consistency. Importantly, this worksheet is for learning and display purposes only; conducting a functional analysis requires competence, consent, risk review, and individualized safeguards.
Table of Contents
- What Is a Functional Analysis Graph?
- Rate Formula for Variable Session Durations
- Graph Setup Checklist
- Preserving Chronological Order in a Multielement Display
- Interpreting the Functional Analysis Graph
- Contextualizing Graph Patterns with Contingencies and Assessment Quality
- Condition Discrimination and the Functional Analysis Graph
- Ethical and Competence Considerations
- Study Checklist for BCBA Candidates
- Test Your Understanding
- Take the Free BCBA Mock Exam
- References
- Turn this topic into exam-day practice
What Is a Functional Analysis Graph?
A functional analysis graph displays a defined dependent measure across ordered sessions, with separate data paths for the assessment conditions. The x-axis shows session number in chronological order; the y-axis names the measure and its units, such as responses per minute. Each condition receives a distinct, consistently styled series and a matching condition legend. In a multielement display, the analyst inspects whether responding is repeatedly differentiated across test and control conditions. A higher escape-series pattern may support an escape-contingency hypothesis only when the programmed contingencies, repeated observations, treatment integrity, measurement quality, and plausible competing explanations also support that interpretation.
Rate Formula for Variable Session Durations
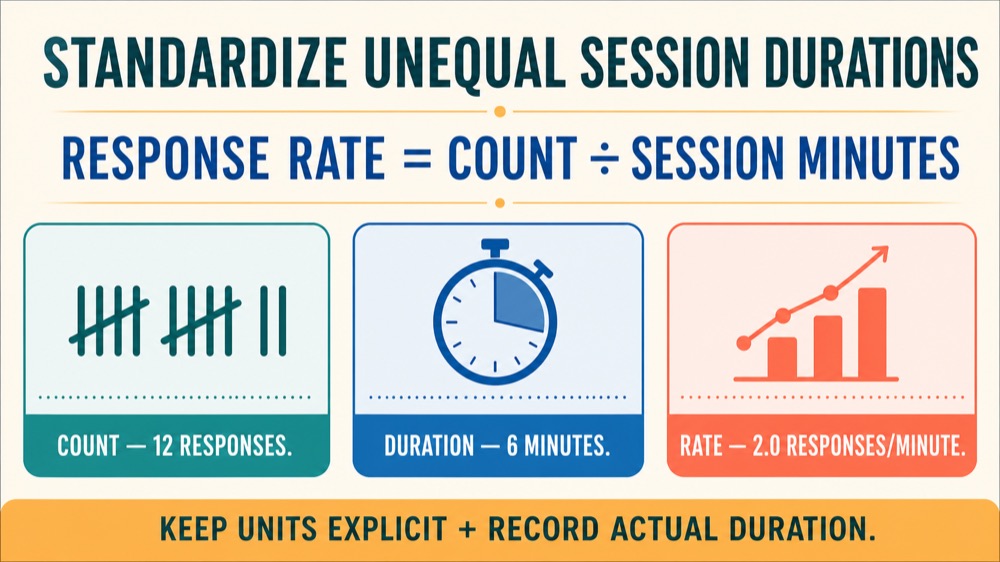
When sessions differ in observation time, raw counts are not directly comparable. For a countable target response, standardize with Response rate = Count of responses ÷ Session duration in minutes. For example, 12 responses during a 6-minute session equal 2.0 responses per minute, while 8 responses during a 10-minute session equal 0.8 responses per minute. Record the actual duration for every session and use a measure appropriate to the response definition. Counts can remain meaningful when observation time and relevant opportunities are comparable, but unequal exposure requires a defensible denominator. The table below is a neutral, hypothetical learning dataset and not a protocol for arranging assessment conditions.
| Session # | Condition | Count | Duration (min) | Response Rate/min |
|---|---|---|---|---|
| 1 | Alone | 2 | 10 | 0.2 |
| 2 | Attention | 8 | 5 | 1.6 |
| 3 | Play | 1 | 10 | 0.1 |
| 4 | Escape | 10 | 6 | 1.7 |
| 5 | Alone | 1 | 10 | 0.1 |
| 6 | Escape | 12 | 5 | 2.4 |
| 7 | Play | 0 | 10 | 0.0 |
| 8 | Attention | 9 | 5 | 1.8 |
Calculating Rate: Worked Examples:
- Example 1: 15 responses in 5 minutes. Rate = 15/5 = 3.0 responses per minute.
- Example 2: 2 responses in 10 minutes. Rate = 2/10 = 0.2 responses per minute.
- Example 3: 0 responses in 8 minutes. Rate = 0/8 = 0.0 responses per minute.
Graph Setup Checklist
- Use session number (chronological order) on the x-axis; label clearly.
- Define the dependent measure (e.g., responses per minute) on the y-axis with units.
- Create a separate data series for each condition; use distinct, consistent symbols (e.g., filled circles for escape, open triangles for attention, X for alone, squares for play).
- Connect successive observations within each condition in chronological order when a line is used; do not connect across an unobserved session.
- Include a condition legend identifying symbols and line styles.
- Set consistent y-axis scale across conditions for valid comparison (e.g., all graphs 0–5 rpm).
- If a session is missed, leave a gap or note; do not interpolate.
- Avoid smoothing or aggregation that conceals session-by-session variability.
- Describe apparent differentiation cautiously and verify that the pattern replicates; do not turn a visual label into a causal conclusion.
Preserving Chronological Order in a Multielement Display
In a multielement (alternating treatments) design, conditions are rapidly alternated. The graph must preserve session order on the x-axis; do not reorder data by condition. For example, if session 1 is Alone, session 2 is Attention, session 3 is Play, session 4 is Escape, the x-axis remains 1, 2, 3, 4. This allows the viewer to detect sequence effects (e.g., carryover from one condition to the next). Consistent scales are critical: if the y-axis ranges change between conditions, misinterpretation may occur. Missing sessions should be shown as a break in the data path or a gap; never connect across a missing point. Do not average sessions within a condition—each data point represents a single session.
Interpreting the Functional Analysis Graph
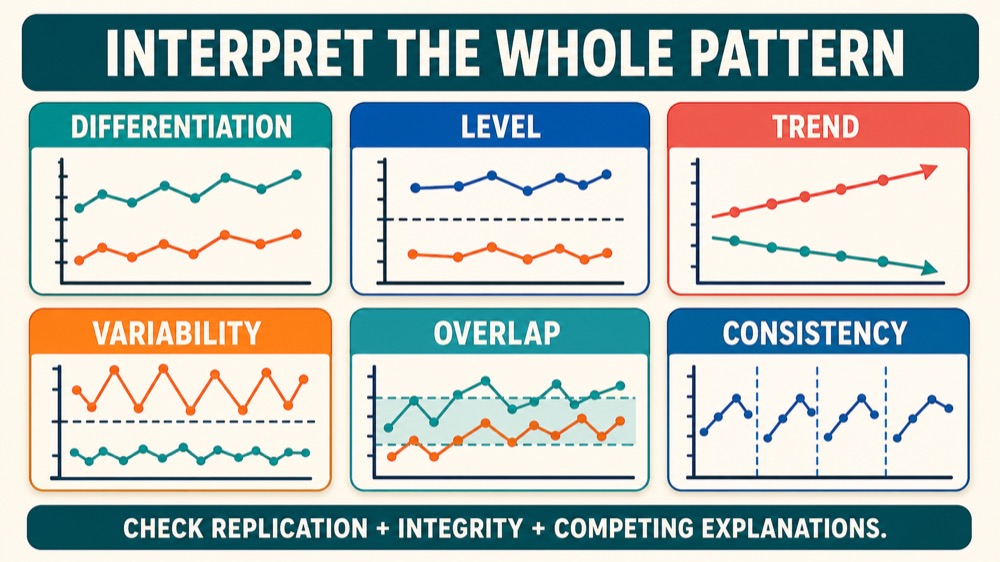
Visual inspection integrates differentiation, level, trend, variability, overlap, and consistency. Level is the vertical position and range of a series, not merely its mean. Trend describes systematic direction over ordered sessions and may strengthen or complicate an interpretation depending on timing and condition sequence. Variability describes fluctuation that can obscure or qualify separation. Overlap describes shared ranges between relevant series but is not a causal test by itself. Consistency asks whether a similar condition-specific pattern recurs across repeated opportunities. These features are considered together with the design and implementation evidence. Common Traps in Visual Inspection:
- Overinterpreting a single high data point: The highest single data point does not identify behavioral function; look for overall pattern across sessions.
- Equating correlation with causation: A graph alone does not prove a functional relation; it must be interpreted in the context of programmed contingencies and assessment quality (e.g., treatment integrity, fidelity of condition implementation).
- Averaging conditions together: Do not average data across different conditions; this conceals the very differentiation the FA is designed to detect.
- Ignoring exposure time or opportunities: use a common unit and a defensible denominator when sessions are unequal; do not compare unequal raw counts as if exposure were identical.
Sample interpretation of the hypothetical table: The two Alone observations are 0.1–0.2 responses per minute, the two Play observations are 0.0–0.1, the two Attention observations are 1.6–1.8, and the two Escape observations are 1.7–2.4. Thus, both Attention and Escape are elevated relative to Play in this small illustration. Because this illustration contains two observations per condition, additional replication is needed before considering a functional-relation conclusion or a primary-versus-secondary function ranking. The defensible next step is to seek replicated condition-specific differentiation while checking sequence, fidelity, measurement, risk, and alternative explanations.
Contextualizing Graph Patterns with Contingencies and Assessment Quality
A graph pattern is never interpreted in a vacuum. The analyst checks whether programmed contingencies were delivered as intended, whether measurement units and session durations were handled consistently, and whether condition order, carryover, or another contextual event could account for the pattern. Repeatedly placing one condition in the same ordinal position, for example, can confound a condition effect with a sequence or time-of-session effect. The control condition must be designed for the individual assessment and implemented with integrity; a poorly matched or inconsistently implemented control can exaggerate apparent differentiation.
Condition Discrimination and the Functional Analysis Graph
Condition-correlated stimuli can help participants discriminate which contingency is operating, but phase labels, materials, or demands should not automatically be called SDs or SΔs. Those functional terms require evidence from a relevant reinforcement history and differential responding. A separated data path may be consistent with condition discrimination while still requiring assessment of programmed consequences, sequence effects, and alternative stimulus differences. For the underlying concepts, see Stimulus Control in ABA and Stimulus Generalization in ABA.
Ethical and Competence Considerations
Functional analysis can deliberately arrange contingencies associated with dangerous or disruptive responding, so this worksheet is for learning and display only and is not a do-it-yourself protocol. The responsible professional must work within demonstrated competence and authorized scope, obtain and document informed consent from the legally authorized individual and assent when applicable, review risks and benefits, protect client welfare, and use individualized safeguards such as stopping criteria and emergency plans. The current BACB Ethics Code addresses these responsibilities across client services, assessment, treatment, competence, and documentation; no credential label by itself establishes competence for a particular case.
Study Checklist for BCBA Candidates
- Describe level, trend, variability, overlap, consistency, and condition-specific differentiation without relying on one feature alone.
- Compute response rate from count and actual session duration, keeping units explicit.
- Create a functional analysis graph manually or in spreadsheet software to verify chronological order, axes, series, and legend.
- Explain whether an apparent difference replicates and what evidence still limits the interpretation.
- Check treatment integrity, measurement quality, condition order, and missing observations before drawing conclusions.
- Review the current BACB BCBA Test Content Outline sections on measurement, data display, interpretation, and experimental design.
- Avoid single-point conclusions, hidden aggregation, invented missing values, and unequal raw-count comparisons.
Test Your Understanding
Try this original display exercise: a defined target response yields Alone data of 0.1, 0.0, and 0.2 responses per minute; Attention data of 2.3, 1.9, and 2.1; and Play data of 0.2, 0.1, and 0.0 across interspersed ordered sessions. The Attention series is differentiated from Play in this hypothetical pattern because its three observations are consistently higher with no range overlap. That description supports an attention-contingency hypothesis only within the programmed arrangement; a professional conclusion also requires adequate replication, integrity, measurement, risk review, and consideration of competing explanations.
Use our Free BCBA Mock Exam for independently written practice and feedback across behavior-analytic content. It does not reproduce live BACB items or promise that this exact graphing topic appears. Pair practice results with the current official outline and the graphing references below to identify concepts that need further study.
Take the Free BCBA Mock Exam
Ready for more practice? Use the free mock exam to keep testing your accuracy with realistic BCBA-style items. Take the Free BCBA Mock Exam
References
- BACB BCBA Test Content Outline (6th ed.)
- Creating Functional Analysis Graphs Using Microsoft Excel (PMC6411563)
- Functional Analysis of Problem Behavior: A Review (PMC2846577)
Next step for BCBA exam prep
Turn this topic into exam-day practice
Use this topic as a focused review, then test it in exam-style conditions with a free mock before deciding whether five full-length mocks are the right next step.
Start the Free BCBA Mock Exam
Continue with Five Full-Length Mocks — $99
Review the included materials and access details before ordering. No pass guarantee is implied.



