
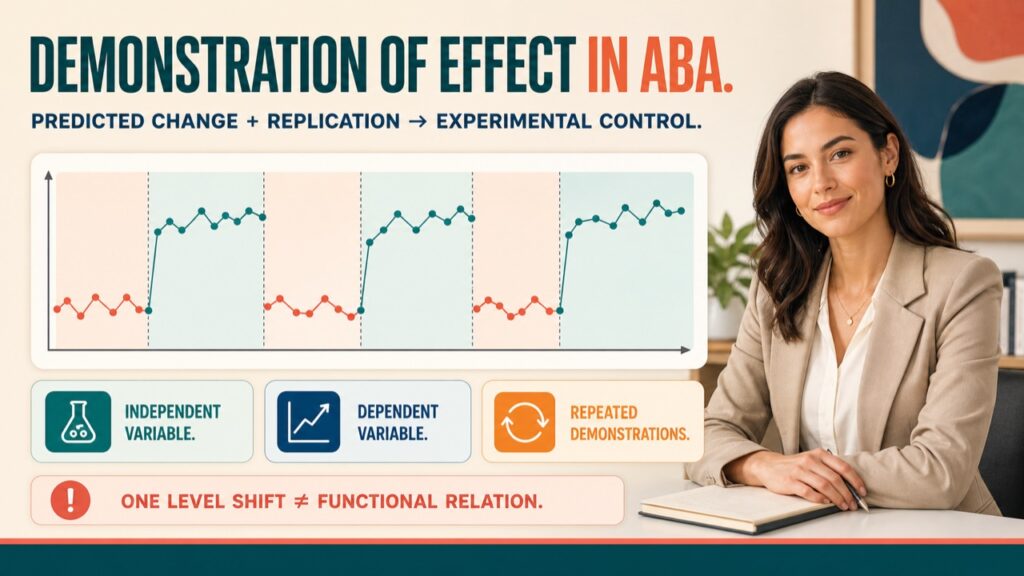
What Is Demonstration of Effect in ABA?
In applied behavior analysis, a demonstration of effect is a predicted change in the dependent variable associated with systematic manipulation of the independent variable. A single phase contrast can show one indication of an effect; experimental control requires replication arranged by the design at different points in time, across tiers, across criteria, or through repeated differentiation between conditions. The conclusion integrates the full data pattern and considers competing threats rather than treating one transition as proof. The current BACB BCBA Test Content Outline (6th ed.) connects this logic to prediction, verification, replication, interpretation, design selection, and application.
Table of Contents
- What Is Demonstration of Effect in ABA?
- Key Designs for Demonstration of Effect
- Visual Analysis Dimensions for Demonstration of Effect
- The Three Demonstrations Standard
- Common Traps and Misconceptions
- Study Checklist for Demonstration of Effect
- Free BCBA Mock Exam
Stimulus control and experimental control answer different questions. Discriminative control concerns a response occurring differently in the presence of stimuli because of a relevant reinforcement history. Experimental control concerns whether repeated manipulation of an independent variable produces predicted changes in a measured outcome while plausible alternatives are addressed. A treatment package, phase label, or token display should not automatically be called an SD. The design must show the IV–DV relation, and stimulus functions require their own evidence. See stimulus control in ABA for that functional distinction.
Key Designs for Demonstration of Effect
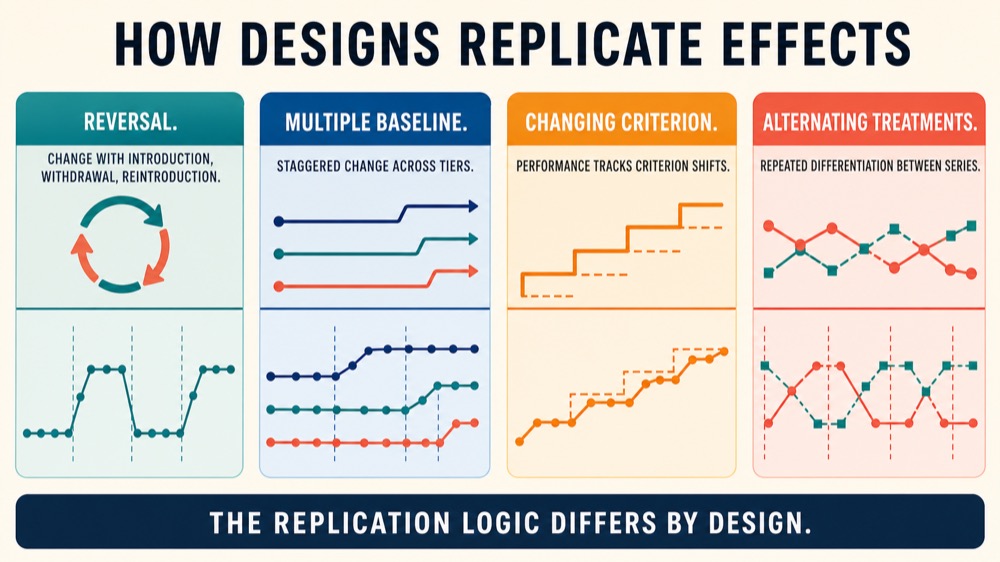
Each single-case design uses a unique logic to demonstrate experimental control. The common thread is that the IV must be manipulated systematically, and the DV must change in a predictable manner. Below are the primary designs and how they arrange opportunities for demonstration of effect. Understanding these designs is essential for evaluating research and analyzing graphs.
Reversal or withdrawal designs: An ABAB arrangement introduces the IV, withdraws it, and reintroduces it. Predicted change at the first B transition, the return toward the baseline pattern at the second A transition, and renewed change at the second B transition can provide three demonstrations at different points in time. The logic depends on repeated correspondence between phase changes and the DV, not on the letters themselves. Irreversible learning, carryover, risk, ethics, or unacceptable withdrawal can make this design unsuitable.
Multiple-baseline designs: The IV is introduced at different times across participants, settings, or behaviors. A convincing pattern combines change in the treated tier with continued prediction in untreated tiers, followed by replicated change as the IV reaches each tier. Staggering helps address a shared history explanation when untreated tiers do not change at the same time, but tier dependence, coincidental events, unstable baselines, and weak staggering still require review.
Changing-criterion designs: The criterion is changed in a planned series, and the DV is expected to track those changes. Experimental control is strengthened when performance repeatedly shifts toward new criteria, step sizes are sufficiently discriminable, phase data are adequate, and bidirectional or otherwise varied criteria reduce a simple coincidental-trend explanation. A criterion phase is an opportunity for a demonstration; the number of data points inside it is not the number of demonstrations.
Alternating-treatments designs: Two or more conditions are rapidly and repeatedly alternated, often with counterbalanced order or distinctive condition cues. Replicated differentiation between condition-specific data series can demonstrate an effect. Interpretation considers sequence effects, multiple-treatment interference, carryover, unequal exposure, and whether the conditions were implemented with integrity. The replication logic is repeated separation between series, not a baseline-to-treatment reversal.
Across all four designs, the analyst distinguishes an indication of change at one comparison from repeated demonstrations that support a functional relation. The same number of phases can provide different evidentiary value when baselines are unstable, changes are delayed, data overlap extensively, fidelity is weak, or another event predicts the outcome just as well as the IV.
Measurement quality is part of that judgment. The dependent variable should be operationally defined and measured in a way that is sensitive to the predicted effect. Observers should apply the definition consistently, and any changes in recording systems, observation periods, or opportunities to respond should be considered before attributing a shift to the intervention. Interobserver agreement can support confidence that observers recorded the same events, but agreement alone does not establish that the measure is valid or that the IV caused the change.
Implementation evidence matters for the independent variable as well. Treatment-integrity data help the analyst determine whether a condition was delivered as planned and whether unintended differences between phases could explain the result. A weak outcome during low-integrity implementation is not a clean test of an effective procedure, while a favorable outcome that coincides with uncontrolled procedural changes is not a clean causal demonstration. Social validity, safety, assent, and clinical importance remain separate considerations: a graph may support a functional relation without showing that the procedure is acceptable, worthwhile, or appropriate to continue.
Finally, the analyst asks whether the design’s predictions were testable before looking at the outcome. If baseline data already move strongly in the desired direction, an intervention-phase improvement may add little evidence. If change begins before the IV, occurs simultaneously in untreated tiers, or fails to replicate at later opportunities, a competing explanation becomes more plausible. Demonstration of effect is therefore a structured inference from measurement, timing, design logic, replication, and procedural evidence—not a label assigned because a graph looks dramatic.
Visual Analysis Dimensions for Demonstration of Effect
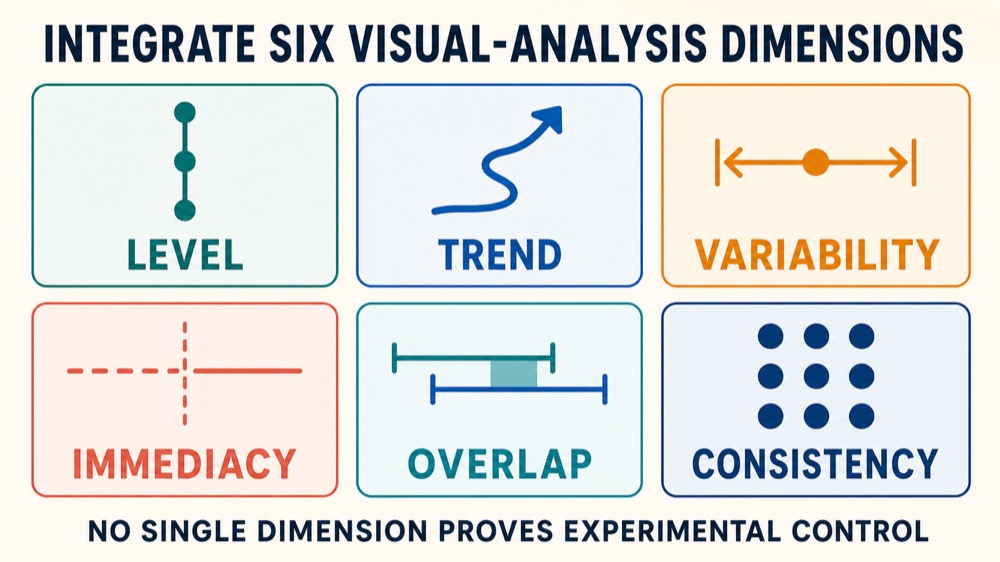
Visual analysis is the primary method for evaluating whether a demonstration of effect exists. The What Works Clearinghouse (WWC) single-case design standards outline six dimensions: level, trend, variability, immediacy of effect, overlap, and consistency across similar phases. Each dimension is assessed within and across phases. No single dimension alone proves experimental control; they must be integrated.
- Level: The vertical position of data within a phase, considered with the range and other features rather than reduced to one summary value.
- Trend: The direction and rate of change within a phase, including whether baseline trend already predicts movement in the intervention direction.
- Variability: The spread or fluctuation of data around the phase pattern; its meaning depends on measurement, context, trend, and the size of the predicted change.
- Immediacy of effect: The change between data near a phase transition, interpreted with expected latency and the procedure’s plausible time course.
- Overlap: The extent to which data from adjacent conditions occupy the same range. Less overlap may strengthen a contrast, but it is never sufficient by itself.
- Consistency across similar phases: Similar patterns across all baseline or intervention phases increase credibility.
Visual analysis first evaluates predictability within phases, then compares adjacent or otherwise relevant phases, and finally integrates demonstrations across the whole design. Low overlap and rapid change may support the interpretation, but conflicting trend, unstable measurement, inconsistent replication, or an uncontrolled event can weaken it. The six dimensions are evaluated individually and collectively; none is a shortcut score for causality.
The Three Demonstrations Standard
The cited WWC technical documentation requires at least three demonstrations of an effect at different points in time for its evidence classification, after the design itself meets applicable standards. Three demonstrations are replications of predicted IV–DV relations—not three observations, three sessions, or any three phase labels. An AB comparison supplies one opportunity, whereas an appropriately executed ABAB or staggered three-tier design can arrange three. Exact adequacy still depends on design logic, sufficient data within phases, stability and trend, timing, fidelity, independence of tiers when relevant, and competing threats. A clinical decision made with a different evidentiary goal should be described honestly rather than relabeled as meeting a research standard.
Common Traps and Misconceptions
- A lone level shift is one indication: It can coincide with history, measurement change, trend, or another event. Replication arranged by the design is needed for a functional-relation claim.
- Observations are not replications: Several data points within one condition help establish a pattern, but they do not become separate demonstrations merely because they are plotted separately.
- Statistical testing is not a universal prerequisite: Single-case conclusions can be based on design logic and systematic visual analysis; quantitative analyses may supplement the judgment when appropriate.
- No-overlap is not a causality switch: Even complete separation must be interpreted with trend, immediacy, variability, consistency, fidelity, design quality, and competing explanations.
- Replication logic depends on design: Reversal, multiple baseline, changing criterion, and alternating treatments create different opportunities for prediction, verification, and replication.
Study Checklist for Demonstration of Effect
Use this checklist when analyzing a single-case graph in study or professional work:
- Identify the independent variable and dependent variable.
- Identify where the design creates opportunities for prediction, verification, and replication; do not equate a phase change with a successful demonstration.
- Assess level change between adjacent phases.
- Examine trend and variability within each phase.
- Look for immediacy of effect after IV introduction.
- Describe overlap together with level, trend, variability, immediacy, and consistency; do not apply an invented universal percentage cutoff.
- Check consistency across similar phases (e.g., both baseline phases in an ABAB).
- Determine whether the data, not merely the layout, show at least three predicted demonstrations at different points when applying the cited WWC standard.
- Consider threats: history, maturation, instrumentation, attrition.
- Decide if experimental control is convincing based on all dimensions.
Free BCBA Mock Exam
Use our Free BCBA Mock Exam for independently written practice and feedback across behavior-analytic content. It does not reproduce live BACB items or promise this exact topic. The current BCBA Test Content Outline (6th ed.) explicitly includes single-case design features, interpretation, design distinctions, and application, while the phrase “demonstration of effect” is best studied through that experimental logic rather than as a promised item label. For the research-standard boundary, consult the WWC Single‑Case Design Technical Documentation.



