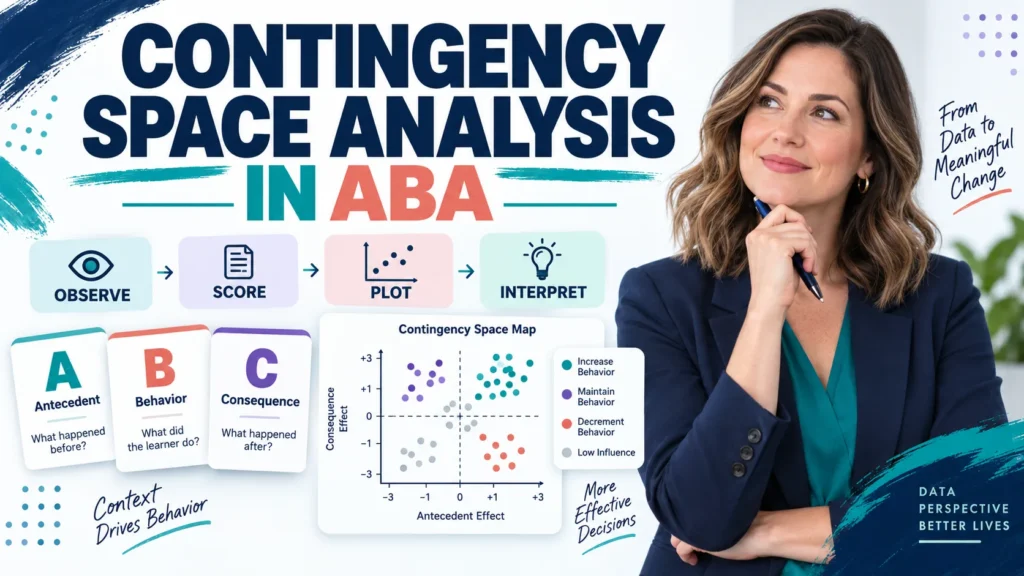
A practical BCBA study guide to contingency space analysis in ABA: how sequential ABC observations become conditional probabilities, a visual contingency map, and a more careful behavioral hypothesis. Contingency space analysis ABA—more naturally written as contingency space analysis in ABA—is a way to examine whether a consequence is more likely after a behavior than when that behavior does not occur. It uses sequential observational data, conditional probabilities, and a visual plot to describe possible behavior–consequence relations. The method can make patterns easier to see, but a pattern in descriptive data is not the same as experimental proof that a consequence caused behavior.
Table of Contents
- Contingency Space Analysis ABA: What the Method Means
- From ABC Observation to a Contingency Space Map
- How the Method Works Step by Step
- How to Read the Contingency Space
- A Fictional Worked Example
- CSA vs. Descriptive Assessment vs. Functional Analysis
- What CSA Can and Cannot Tell You
- BCBA Exam and Practice Questions
- Ethics, Privacy, and Decision Boundaries
- Frequently Asked Questions
- Quick Review Checklist
- Take the Free BCBA Mock Exam
If you are preparing for the BCBA exam, the important distinction is simple: contingency space analysis can help organize and interpret descriptive assessment data, while a functional analysis uses planned manipulation and experimental control to test a functional relation. The two methods can inform clinical reasoning, but they answer different evidence questions.
Scope note: This is an educational explanation, not a protocol for conducting an assessment with a client. Follow your training, supervision, organization procedures, current ethics requirements, privacy safeguards, and the qualified clinician’s judgment before collecting or interpreting clinical data.
Contingency Space Analysis ABA: What the Method Means
Contingency space analysis (CSA) is an observational method for describing the relation between an event or behavior and an event that follows it. The central comparison is usually between the probability of a consequence when the behavior occurred and the probability of that consequence when the behavior did not occur:
P(C | A) asks how often consequence C occurred when event or behavior A occurred. P(C | not A) asks how often C occurred when A did not occur. The difference between those probabilities is a way to summarize the direction and size of a possible contingency in the observed data.
For example, if access to an item follows a response in many observed instances but rarely occurs during comparable periods without the response, the data may suggest a positive behavior–consequence relation. That result can help a behavior analyst decide what to examine next. It does not prove that the item caused the response, because the observations may contain omitted variables, selection effects, timing problems, or an unmeasured event that influenced both.
The original research literature describes CSA as an alternative way to identify contingent relations from observational data by examining conditional probabilities. For a detailed research reference, see the open-access Contingency Space Analysis paper in PubMed Central. Treat the paper as a method reference, not as a universal clinical recipe.
From ABC Observation to a Contingency Space Map
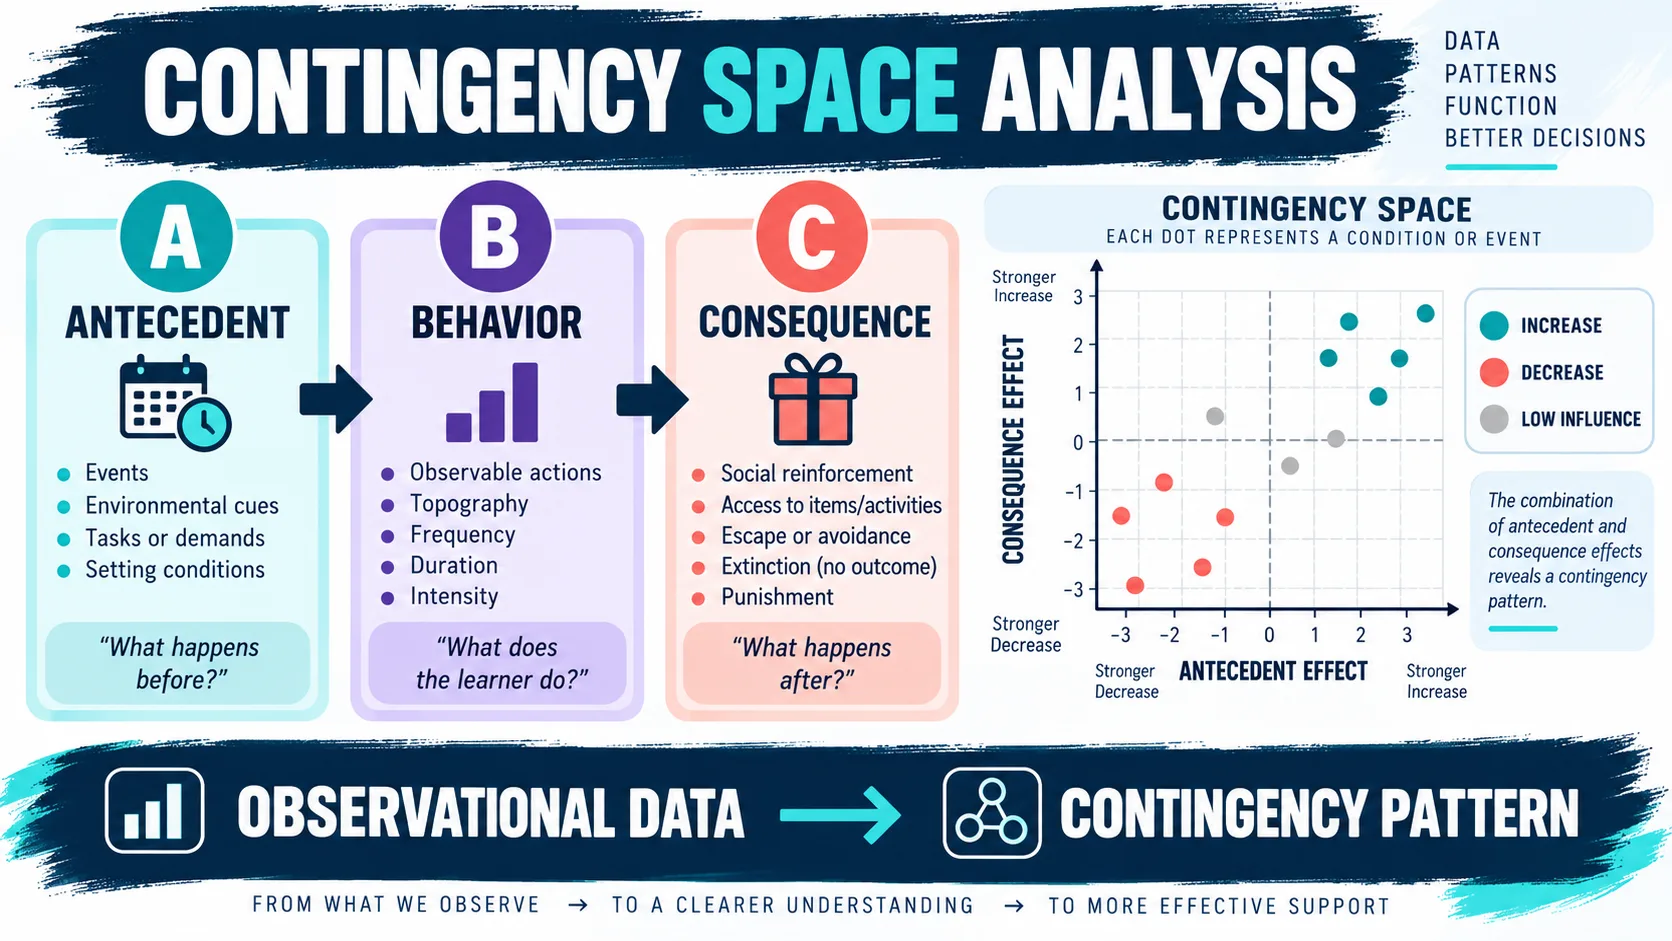
CSA starts with well-defined events. In a familiar ABC observation, the observer records what happened before the behavior, the target response itself, and what happened after it. For a contingency-space calculation, the behavior or event being tested is often represented as A and the possible consequence as C. The labels are less important than the operational definitions and the timing rule.
| Element | Operational question | Common error |
|---|---|---|
| A: target event | What observable response or event counts, and when does it start and stop? | Using a label such as “meltdown” without an observable definition. |
| C: possible consequence | What event after A is being tested, and what time window counts as “after”? | Changing the consequence window from one observation to another. |
| Not A | What comparable observation periods contain no A, and are they recorded consistently? | Treating missing data as proof that A did not occur. |
| Sequence | Can the observer establish the order and time relation among events? | Assuming that events close in time are automatically contingent. |
How the Method Works Step by Step
1. Define the response and consequence: Write an operational definition for A and a concrete definition for C. Include examples, nonexamples, start and stop rules, and the time window for a consequence. If the event can occur repeatedly, decide whether the unit is each response, each episode, or each observation interval.
2. Record sequential observations: Record the relevant events in order rather than relying on a retrospective summary. The observer needs enough information to identify periods with A, periods without A, and whether C followed within the agreed window. Use de-identified records and approved systems.
3. Separate A from not A: The comparison group matters. “Not A” should mean an observed opportunity or time period in which A did not occur, not a blank row or an unknown. If the observer stopped watching whenever A did not occur, the comparison probability may be misleading.
4. Calculate conditional probabilities: Calculate the proportion of A observations followed by C and compare it with the proportion of not-A observations followed by C. The exact computation should match the research method and data structure. Do not replace a careful denominator with a raw count or a percentage of all observations.
5. Plot and interpret the relation: A contingency space plot places one conditional probability on each axis. Points can show whether the consequence is more likely after A, less likely after A, or similarly likely in both conditions. The plot is a visual summary of observed relations; it is not a causal graph.
6. Link the result to the next question: Use the result to decide what additional information is needed. You may need more observations, a better definition, a different comparison, a direct assessment, a functional analysis, or consultation with the supervising behavior analyst. A cautious conclusion is more useful than a confident claim the data cannot support.
How to Read the Contingency Space
Many diagrams place P(C | A) on one axis and P(C | not A) on the other. When the first probability is higher than the second, C is more likely after A in the observed sample. When the second is higher, C may occur more often when A is absent. When the two values are similar, the observed data show little separation for that pair of events.
| Observed comparison | What it may suggest | What it does not establish |
|---|---|---|
| P(C | A) greater than P(C | not A) | C occurred more often after A in the observed sample. | That C caused A or that changing C will reliably change A. |
| P(C | A) less than P(C | not A) | C was more common in periods without A. | That C suppresses A or functions as punishment. |
| Probabilities are similar | The observation shows little separation between the two conditions. | That no relevant relation exists; measurement or sampling may need review. |
A Fictional Worked Example
Imagine a fictional observation in which A is “a learner pushes the worksheet away” and C is “the worksheet is removed within 30 seconds.” In 20 observed instances of A, C follows 15 times. In 30 comparable periods without A, C occurs 3 times. The descriptive probabilities would be:
| Condition | C occurred | Opportunities | Probability |
|---|---|---|---|
| A occurred | 15 | 20 | P(C | A) = 0.75 |
| A did not occur | 3 | 30 | P(C | not A) = 0.10 |
The difference is 0.65 in this fictional example, so the consequence was much more common after A than during the comparison periods. A behavior analyst might treat that pattern as a reason to ask whether escape or task-removal contingencies deserve further assessment. The analyst should not announce that the worksheet caused the behavior or that removing it is the function without reviewing the observation quality, alternative explanations, safety, and additional assessment evidence.
CSA vs. Descriptive Assessment vs. Functional Analysis
These terms are related but not interchangeable. A descriptive assessment observes behavior in its natural context and records antecedent and consequence events. Contingency space analysis is one way to analyze some sequential descriptive data. A functional analysis deliberately arranges test and control conditions to evaluate whether manipulating a variable changes behavior. The method selected should match the question, risk, training, and supervision available. The site’s functional analysis versus descriptive assessment guide provides a companion comparison. For current professional boundaries, review the BACB Ethics Code resources rather than relying on an old study note.
What CSA Can and Cannot Tell You
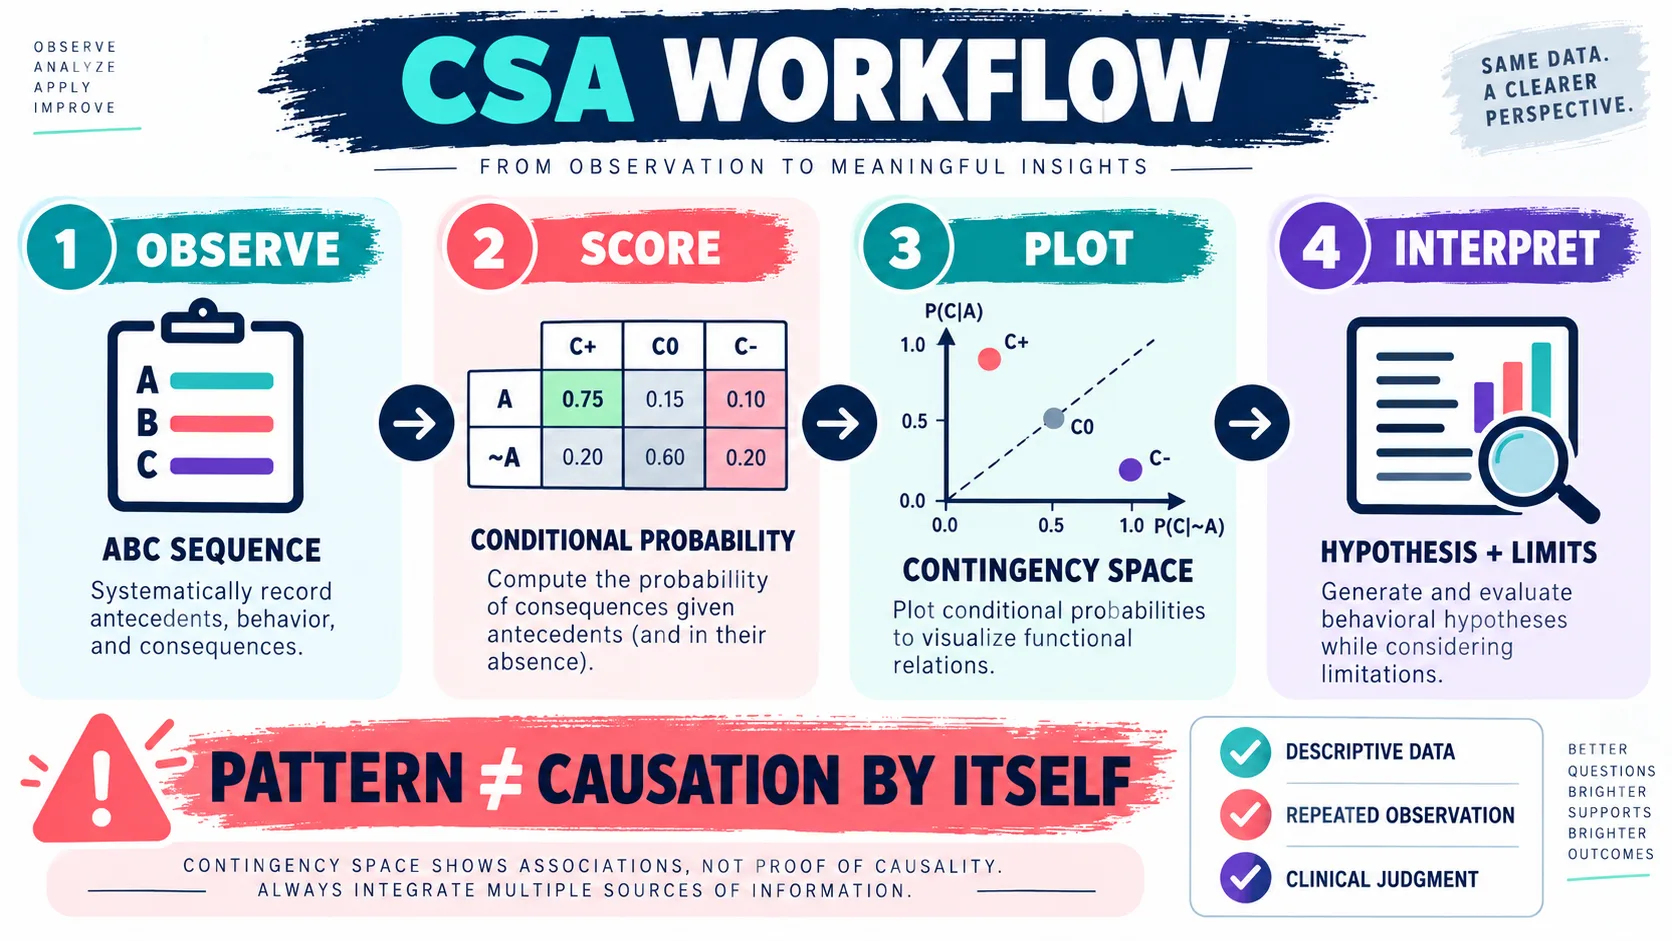
CSA can make conditional relations visible, compare how often an event follows behavior versus nonbehavior periods, and help organize a descriptive-assessment discussion. It can also highlight questions that a simple ABC narrative hides, especially when several possible consequences occur across observations.
CSA cannot, by itself, prove a functional relation, establish that a consequence is a reinforcer, justify a treatment change, or replace a functional analysis when an experimental demonstration is needed. It also cannot fix weak sampling, unclear definitions, observer drift, or a denominator that does not represent genuine opportunities.
Interpretation should include the data source, observation window, definitions, missingness, potential confounds, and the decision that the result will and will not support. If a high-risk behavior is involved, safety and client welfare take priority over producing a neat plot.
BCBA Exam and Practice Questions
On a BCBA-style item, look for the evidence level in the stem. If the prompt describes naturalistic observation and conditional probabilities, CSA or descriptive assessment may be the best match. If it describes manipulating attention, demand, alone, or play conditions while comparing a control condition, the item is testing functional-analysis logic.
Common traps include confusing correlation with causation, treating a consequence as a reinforcer because it was delivered, using the total number of observations as the denominator for every probability, or assuming that a descriptive relation automatically dictates intervention. Ask four questions: What was observed? What was manipulated? What was measured? What conclusion is justified? Use the functional-analysis practice questions for scenario retrieval, then use the Free BCBA Mock Exam to check broader pacing and mixed-domain application. Practice performance is study data, not an official BACB score.
Ethics, Privacy, and Decision Boundaries
Observation records can contain sensitive information. Use approved systems, de-identified examples, access controls, and the minimum information needed for the decision. Do not upload identifiable ABC notes to an unapproved tool or share a client’s story in a public study group.
Frequently Asked Questions
What is contingency space analysis in ABA?: It is an observational analysis that compares the probability of a consequence after a behavior or event with the probability of that consequence when the behavior or event did not occur. The comparison can be plotted to visualize an observed contingency.
Is contingency space analysis the same as a functional analysis?: No. CSA analyzes sequential observational data. A functional analysis deliberately arranges test and control conditions and uses experimental control to evaluate a functional relation. CSA may inform what to examine next, but it does not replace experimental analysis.
What does P(C | A) mean?: P(C | A) means the probability of consequence C given that event or behavior A occurred. It should be calculated with a clearly defined denominator and a consistent observation rule.
Can CSA prove that a consequence reinforces behavior?: No. A higher probability of C after A can describe a possible contingency, but it does not by itself prove that C increased future behavior or that a functional relation was demonstrated.
Why are operational definitions important in CSA?: Because the calculation is only as meaningful as the events being counted. Clear start, stop, example, nonexample, and timing rules reduce ambiguity and make the comparison more interpretable.
Bottom line: Contingency space analysis in ABA turns sequential observation into a visual comparison of conditional probabilities. Use it to ask better questions about descriptive patterns, keep its limits visible, and match the next assessment decision to the evidence the data can actually support. For targeted review, use our contingency space analysis aba practice questions to apply the concept in exam-style scenarios.
Quick Review Checklist
Use this final checklist to turn contingency space analysis aba into exam-ready reasoning. The goal is not to memorize a label in isolation; it is to identify the relevant evidence and explain why the best answer fits the scenario. Key ideas to review:
- State the central definition or decision point for contingency space analysis aba in your own words.
- Identify the detail that makes contingency space analysis aba different from its closest related ABA term.
- Separate the observable facts in a scenario from assumptions that are not supported by the facts.
- Write one example and one nonexample so you can recognize the concept in a new setting.
Exam application checks:
- Ask what the question is actually requesting before comparing the answer choices.
- Mark the antecedent, response, consequence, or other evidence that supports the selected answer.
- Look for a distractor that describes a related process but does not answer the specific question.
Final self-check:
- Explain how you would verify the interpretation with clear observations or data.
- Change one detail in the scenario and decide whether your answer should change.
- Give a one-sentence rationale that a supervisor or study partner could evaluate.
Take the Free BCBA Mock Exam
When you are ready to apply the idea, use the free practice resource below for additional feedback. Take the Free BCBA Mock Exam