

Understanding the Abscissa in ABA
When you first encounter a graph in applied behavior analysis, you see two axes forming a frame around the data. The horizontal line running from left to right is the abscissa, also called the x-axis. In ABA, the abscissa is the foundation of visual analysis because it organizes the conditions under which behavior is measured. Without a clear, consistent abscissa, even the most carefully collected data becomes difficult to interpret.
Table of Contents
- Understanding the Abscissa in ABA
- Why the Abscissa Matters in Applied Behavior Analysis
- Abscissa in ABA: Real Examples with ABC Data
- Exam Relevance: Abscissa Questions on the BCBA Exam
- Quick Checklist for Graphing and Interpreting the Abscissa
- Final Summary and Next Steps for BCBA Candidates
- Take the Free BCBA Mock Exam
The concept of abscissa aba is more than a vocabulary term; it is a practical tool that shapes how behavior analysts communicate findings. Whether you are reviewing a line graph in a behavior intervention plan or constructing a graph for a supervision meeting, understanding the abscissa helps you ask the right questions about time, sessions, and experimental conditions. For BCBA candidates, mastering this term is a small but essential step toward fluency in graphical analysis.
What is the Abscissa? A Simple Definition: The abscissa is the horizontal axis of a graph. In most ABA graphs, it represents time, such as sessions, days, or hours. However, the abscissa can also represent other independent variables, such as different participants or experimental conditions. The values on the abscissa are typically plotted evenly spaced, and the labels must clearly indicate what each unit represents.
The Abscissa vs. the Ordinate in ABA: The ordinate, or y-axis, is the vertical axis. While the abscissa shows the independent variable, the ordinate typically displays the dependent variable—the behavior being measured. A simple memory aid: X marks the time or X is across. This distinction is crucial because mislabeling these axes is a common error, especially under exam pressure.
Why the Abscissa Matters in Applied Behavior Analysis
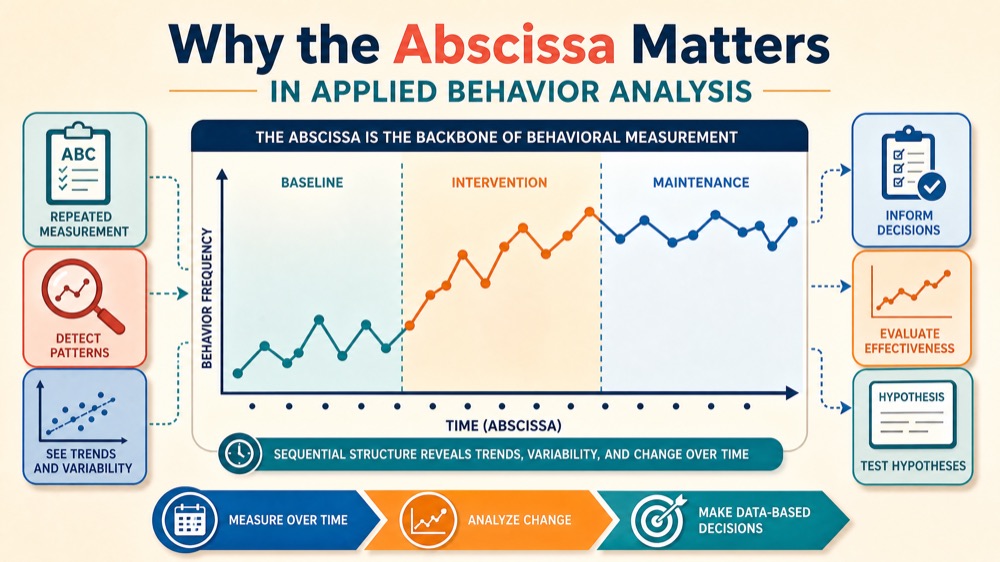
The abscissa is not just a line; it is the backbone of behavioral measurement. In ABA, we rely on repeated measurement over time to detect patterns. The abscissa provides the sequential structure that allows practitioners to see trends, variability, and level changes. Without a properly scaled and labeled abscissa, the data lose their meaning, and decisions become guesswork.
For example, when a behavior analyst tracks on-task behavior across a school week, the abscissa might list Monday through Friday. Each data point plotted on the graph corresponds to a specific day. This alignment enables the analyst to compare morning versus afternoon performance or to identify a pattern of increasing on-task behavior after a token economy is introduced. The abscissa turns raw numbers into a story of behavior change.
The Role of the Abscissa in Behavior Measurement: In most clinical and educational graphs, the abscissa represents consecutive sessions or time intervals. The ordinate typically shows the target behavior, such as frequency, duration, or percentage of intervals. The scale of the abscissa must be uniform to ensure that equal distances correspond to equal time intervals. This uniformity is essential for accurate visual analysis. Common Graph Types in ABA and Their Abscissas: Different graph types use the abscissa in subtly different ways:
- Line graphs—the most common; the abscissa is evenly spaced sessions or days, and each data point is connected to show trends.
- Bar graphs—the abscissa lists discrete categories, such as participants or conditions, and the bars represent average or total behavior.
- Cumulative records—the abscissa still shows time, but the ordinate accumulates behavior counts, and the slope indicates rate.
Understanding these variations is important because exam questions may ask you to identify which graph type is appropriate for a given scenario.
Abscissa in ABA: Real Examples with ABC Data
Connecting the abscissa to real ABA practice helps clarify its functional role. The following examples demonstrate how the abscissa appears in data collection and graph interpretation, including hypothesized functions in functional analysis. Example 1: Increasing On-Task Behavior: A teacher records a student’s on-task behavior during a 20-minute independent work period. The data are collected using partial interval recording, and the abscissa represents each school day from Monday to Friday over a three-week period. The ordinate shows the percentage of intervals with on-task behavior. As the intervention—a self-monitoring checklist—is introduced, the data points on the graph steadily climb. The abscissa allows the teacher to see that improvement began on day four, which aligns with the start of the intervention.
Example 2: Reducing Aggression with Functional Communication Training: In a clinic setting, a behavior analyst implements functional communication training (FCT) to reduce aggression for a child with autism. The abscissa represents each therapy session, numbered from 1 to 30. The ordinate shows the frequency of aggressive behavior and the frequency of FCT responses. During the first five sessions, aggression is high, but after the child learns to request a break using a card, the aggression data decrease. The abscissa clarifies the temporal relationship between the introduction of FCT and the reduction in aggression, demonstrating that the intervention is effective.
Example 3: Hypothesized Function in a Multi-Element Design: In a functional analysis, the abscissa often represents sessions, but the graph also includes condition labels. For instance, a multi-element design alternates between attention, demand, toy play, and ignore conditions across sessions. The abscissa shows the order of sessions, and the ordinate shows the rate of behavior per minute. By examining the data paths, the analyst can identify that the highest rates of aggression occur in the demand condition, suggesting an escape function. The abscissa is essential for tracking the rapid alternation of conditions and interpreting the results.
Exam Relevance: Abscissa Questions on the BCBA Exam
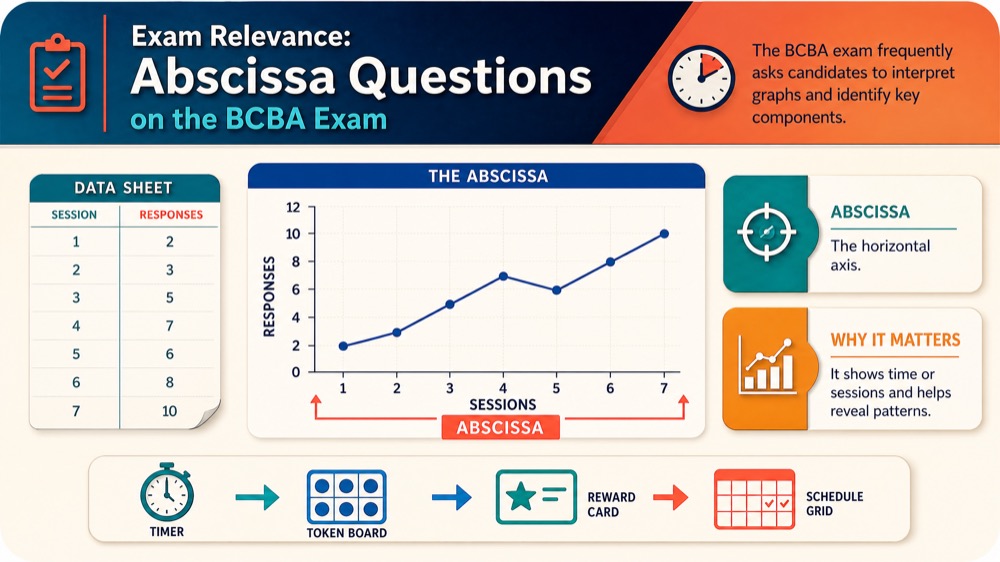
The BCBA exam frequently asks candidates to interpret graphs and identify key components. The abscissa is a recurring topic because it is fundamental to visual analysis. You may encounter questions that require you to label the abscissa, describe what the ordinate measures, or choose the correct graph type for a given scenario.
For example, a sample question might read: “In a line graph depicting the number of mands per session, what does the abscissa represent?” The answer is sessions, because sessions are the independent variable. Another question might ask you to determine if a graph is correctly labeled based on the description of time and behavior. Understanding the abscissa is also essential for identifying trends, levels, and variability—skills that are directly tested in the Behavior Assessment and Behavior-Change Procedures sections of the exam.
Common Traps and Misconceptions: Even well-prepared candidates can fall into these traps:
- Confusing the abscissa with the ordinate—mislabeling the axes is a classic error.
- Misreading time intervals—forgetting that the abscissa must be evenly spaced to accurately interpret trends.
- Assuming the abscissa is always time—it can also represent participants, conditions, or other independent variables.
- Overlooking scale and labeling—a graph with no axis labels is incomplete and unreadable.
When answering graph questions, always check the axis labels first and then identify what the data points represent. This systematic approach reduces errors.
Quick Checklist for Graphing and Interpreting the Abscissa
Use this checklist to reinforce your understanding and to guide your own graph construction:
- Locate the horizontal axis and confirm it is labeled clearly.
- Check that the scale is uniform and appropriate for the data range.
- Determine what variable the abscissa represents (time, sessions, conditions, or participants).
- Verify that the ordinate (vertical axis) measures the dependent variable.
- Note any gaps or breaks in the abscissa that might indicate a change in conditions.
- Use the abscissa to track trends across sessions or time points.
Final Summary and Next Steps for BCBA Candidates
The abscissa is more than a label on a graph; it is the temporal backbone of behavioral analysis. By mastering its definition, applications, and common pitfalls, you strengthen your ability to interpret data and make decisions. This skill is directly relevant to the BCBA exam, where graph interpretation questions reward precise observation.
To continue building your graphical fluency, explore our resources on independent and dependent variables in ABA and continuous measurement methods to deepen your understanding of how behavior is tracked. Also, review the BCBA 6th edition blueprint to see how these concepts are weighted on the exam. For a comprehensive review of visual analysis, consider the BACB resources on graph interpretation.
Take the Free BCBA Mock Exam
Ready for more practice? Use the free mock exam to keep testing your accuracy with realistic BCBA-style items. Take the Free BCBA Mock Exam
Next step for BCBA exam prep
Turn this topic into exam-day practice
Use this topic as a focused review, then test it in exam-style conditions with a free mock before deciding whether five full-length mocks are the right next step.
Start the Free BCBA Mock Exam
Continue with Five Full-Length Mocks — $99
Review the included materials and access details before ordering. No pass guarantee is implied.



