
What Are ABA Statistics?
In applied behavior analysis, practitioners collect repeated direct measurements of behavior across time, often within a single-case experimental design. These measurements produce data paths that reveal patterns essential for clinical decisions. ABA statistics refers to the use of numerical summaries and visual inspection to interpret those data. Statistics can summarize or supplement the data, but they do not replace the design logic or the visual analysis that is central to behavior-analytic practice. This guide explains descriptive statistics, visual analysis, and effect-size measures, and clarifies when each is appropriate. It also provides decision questions to help you choose an analysis that fits your design, measurement scale, clinical question, data quality, and replication.
Table of Contents
- What Are ABA Statistics?
- Descriptive Statistics in ABA: Mean, Median, and Range
- Visual Analysis in ABA: Level, Trend, and Variability
- Effect Size and Nonoverlap Indices in ABA
- When to Use Inferential Statistics in ABA
- Common Traps in ABA Statistics
- Decision Questions for Choosing Your Analysis
- Study Checklist for ABA Statistics
- Free BCBA Mock Exam Practice
The Behavior Analyst Certification Board (BACB) outlines the professional responsibilities of behavior analysts, including the need to interpret data accurately and make data-based decisions. The BACB BCBA Test Content Outline (6th ed.) is the official source for the knowledge and skills expected of BCBAs. While this article does not claim that any specific topic is guaranteed on the exam, understanding how to analyze and interpret behavioral data is a core competency. The goal here is to help you apply these concepts in practice, not to predict exam content.
Descriptive Statistics in ABA: Mean, Median, and Range
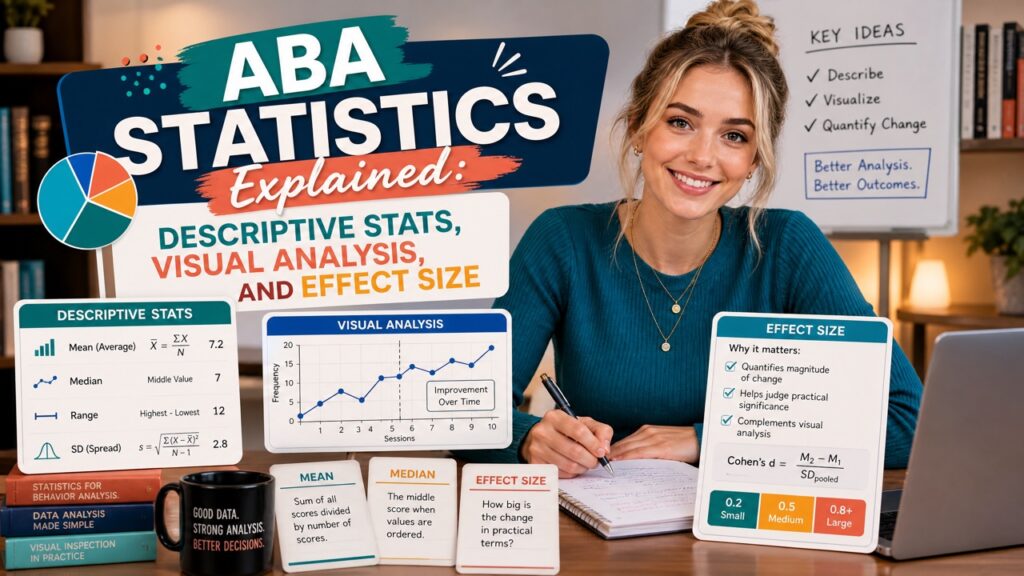
Descriptive statistics summarize a set of data points to describe central tendency and spread. In ABA, the most common descriptive measures are the mean, median, and range. The mean is the arithmetic average, the median is the middle value when data are ordered, and the range is the difference between the highest and lowest values. These measures provide a snapshot of the data’s overall level and spread. However, they omit crucial sequential information, such as trends and abrupt changes. Therefore, descriptive statistics should be interpreted in conjunction with visual inspection of the data graph.
Calculating Mean, Median, and Range with a Clinical Example: Consider a baseline phase where the frequency of a target behavior per session is recorded: 8, 7, 9, 6, 10. The mean is (8+7+9+6+10)/5 = 8.0. To find the median, sort the data: 6, 7, 8, 9, 10; the middle value is 8. The range is 10 – 6 = 4. These values indicate a moderate average level and spread. But they do not reveal whether the behavior is escalating, decreasing, or stable. For instance, data could be increasing from 6 to 10 or decreasing from 10 to 6; the mean, median, and range would be identical. Thus, a graph is essential to see the trend and variability.
- Mean: Sensitive to extreme outliers; useful when data are symmetrical.
- Median: Robust to outliers; more appropriate when data are skewed.
- Range: Only uses two data points; ignores the distribution within.
What Descriptive Statistics Omit: Descriptive statistics lose the temporal order of data points. In ABA, the sequence of measurements is critical because interventions are introduced over time. A graph reveals whether behavior is stable, accelerating, or decelerating, and whether there is overlap between phases. A mean alone cannot capture these dynamics. For example, a baseline phase with a steep upward trend and an intervention phase with a declining trend might have similar means, but visually the intervention is clearly effective. Thus, descriptive statistics should never be used as the sole basis for clinical decisions; they complement, not replace, visual analysis.
Visual Analysis in ABA: Level, Trend, and Variability
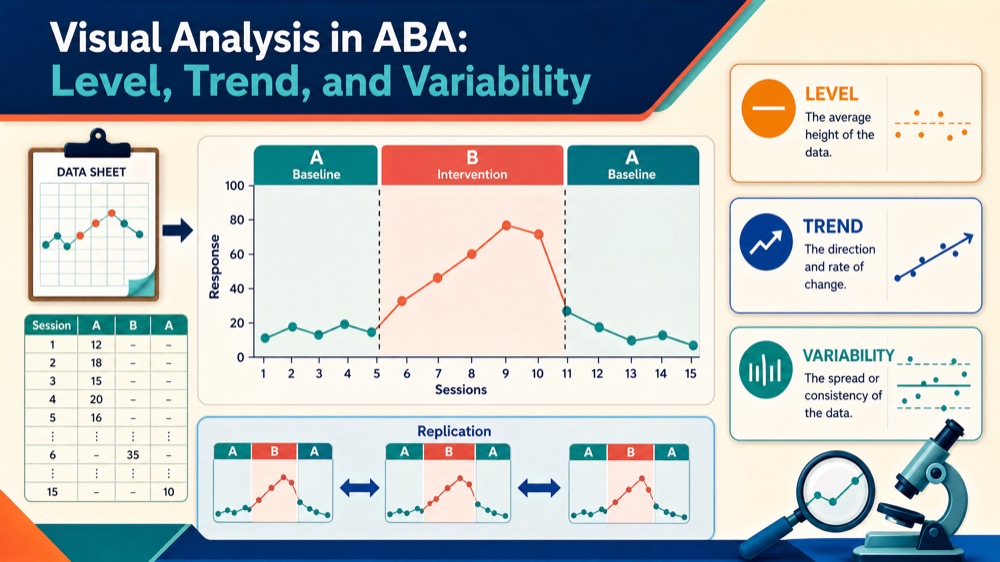
Visual analysis is the primary method for interpreting data in single-case experimental designs. It involves examining a graph for three key dimensions: level, trend, and variability. These dimensions help behavior analysts evaluate the consistency and magnitude of behavior change. While statistics can support this process, they do not replace the trained eye. Visual analysis respects the individual response patterns and the logic of replication, making it a fundamental skill for BCBAs.
Level, Trend, and Variability Defined: Use the points below as a quick study guide.
- Level: The average value of data within a phase, often approximated by the mean or median. Compare levels across phases to see if a change occurs.
- Trend: The overall direction of the data path, which can be increasing, decreasing, or flat. A trend line can be drawn using the split-middle technique or linear regression.
- Variability: The degree of fluctuation in data points around the level. High variability makes it difficult to discern true changes.
For example, in a baseline phase with a stable, flat trend and low variability, predictions about future behavior are reliable. After introducing an intervention, a clear shift in level or a change in trend suggests an effect. Conversely, if baseline is highly variable with an unpredictable trend, it is challenging to attribute any changes to the intervention. Visual analysis allows you to evaluate these patterns holistically.
Overlap and Replication: Overlap refers to the extent to which data points in one phase fall within the range of another phase. Less overlap between baseline and intervention indicates a stronger effect. For instance, if all intervention data points are higher than the highest baseline point, there is zero overlap. Replication is a cornerstone of single-case designs: repeating the intervention across phases (e.g., ABAB) or across participants (e.g., multiple baseline) demonstrates experimental control. Visual analysis relies on replication to establish a functional relation between the intervention and behavior change.
Effect Size and Nonoverlap Indices in ABA
Effect size metrics quantify the magnitude of behavior change, providing a numerical supplement to visual analysis. Common measures include Cohen’s d, which is a standardized mean difference, and nonoverlap indices such as PND (Percentage of Nonoverlapping Data), Tau-U, NAP (Nonoverlap of All Pairs), and IRD (Improvement Rate Difference). These indices compute the degree of separation between baseline and intervention data points. However, they are not required for every intervention and should be used cautiously due to their limitations. The decision to use effect sizes should be based on the clinical question, design, and data quality.
PND and Its Limitations: PND is the percentage of intervention data points that exceed the highest (or lowest) baseline data point. It is simple to calculate but has several drawbacks: it does not account for trends, may be highly influenced by a single outlier, and can produce misleadingly high values when baseline data are unstable. For example, if baseline has a decreasing trend, PND might overestimate the effect even if the intervention is not truly effective. Therefore, PND should not be the sole measure of effect; alternative indices like Tau-U adjust for trend but have their own assumptions.
- PND: Easy but ignores trend and outliers.
- Tau-U: Accounts for baseline trend; more robust.
- NAP: Nonoverlap of all pairs; less sensitive to outliers.
When to Use Effect Size in ABA: Effect size metrics are particularly useful when aggregating outcomes across studies (meta-analysis) or when communicating results to non-behavioral audiences. However, they should not overshadow the clinical significance of the change. A large effect size does not guarantee that the intervention is socially important or produces meaningful improvements in the client’s life. In practice, behavior analysts should prioritize visual analysis of individual data and use effect sizes as supporting evidence.
When to Use Inferential Statistics in ABA
Inferential statistics, such as t-tests or ANOVAs, are used to make probabilistic statements about whether observed differences are due to chance. In ABA, they are not typically used for single-case designs because these designs rely on visual analysis and replication to establish causality. However, inferential statistics may be appropriate in group research or when aggregating data across many participants, such as in meta-analyses. They can also be used to analyze outcomes from large-scale program evaluations. The choice should be guided by the research question, design, and measurement scale.
For a typical BCBA practice, descriptive statistics and visual analysis are sufficient for making data-based decisions. Inferential statistics are not required for every intervention and may actually obscure individual patterns if used naively. For example, a group average might hide that an intervention works for some individuals but not others. Therefore, behavior analysts must understand both approaches and select the one that best answers the clinical question while respecting the data’s structure.
Common Traps in ABA Statistics
Many practitioners struggle with statistics because they over-rely on numerical results or misinterpret graphs. Here are common traps to avoid in practice. Recognizing these will help you make sound clinical decisions.
- Averaging away changes: Collapsing data across phases can hide meaningful shifts in level or trend.
- Ignoring baseline instability: If baseline is highly variable, it is difficult to attribute changes to the intervention.
- Overvaluing effect size: A numerically large effect does not automatically mean the intervention is socially important.
- Using PND as definitive: PND has limitations and should not be the only measure of effect.
- Misinterpreting overlap: High overlap does not always mean no effect; trend and variability matter.
- Ignoring individual patterns: Group averages can obscure individual response differences.
Decision Questions for Choosing Your Analysis
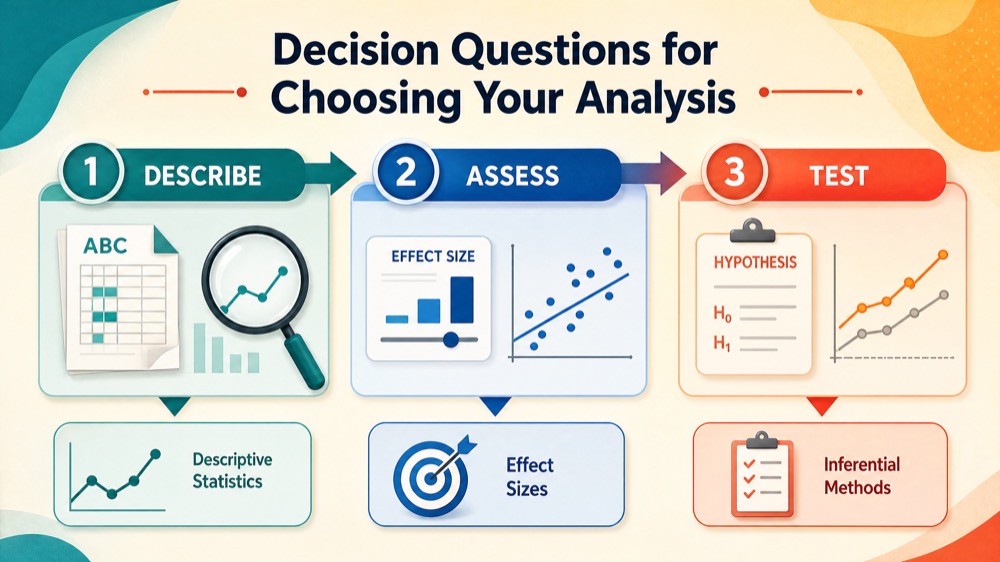
When faced with a dataset, ask yourself the following questions to decide on the appropriate analysis. These questions help you determine whether you need descriptive statistics alone or supplemented by effect sizes or inferential methods.
- What type of design did I use? (e.g., ABAB, multiple baseline)
- What is the measurement scale? (e.g., count, duration, interval)
- What is the clinical question? (e.g., is the intervention effective?)
- Is my data quality high? (e.g., stable baseline, low missingness)
- Have I replicated the effect? (e.g., across phases or participants)
These questions guide you toward either visual analysis alone or supplemented with statistical summaries. Remember that statistics should never be used to mask poor design or unstable data. A well-designed single-case study with clear visual patterns is more compelling than a complex statistical analysis of flawed data.
Study Checklist for ABA Statistics
Use this checklist to guide your study and practice. Each item reinforces a core competency in ABA statistics.
- Define and calculate mean, median, and range accurately.
- Explain why descriptive statistics alone are insufficient for single-case designs.
- Identify level, trend, and variability on a graph.
- Describe overlap and its role in evaluating intervention effects.
- List limitations of PND and other nonoverlap indices.
- Explain when inferential statistics might be appropriate.
- Apply decision questions to choose an analysis method.
Free BCBA Mock Exam Practice
Ready to test your understanding of ABA statistics and other key concepts? Take our free BCBA mock exam to practice with realistic questions and receive instant feedback. This practice tool helps you gauge your readiness for the exam, but does not contain questions on this exact topic. Sign up now to access a free practice test.
Get started with the Free BCBA Mock Exam. For more on related concepts, see our guide on stimulus control and stimulus generalization. Remember, the primary source for exam content is the BACB BCBA Test Content Outline (6th ed.). Always refer to official guidelines for your study plan.
Next step for BCBA exam prep
Turn this topic into exam-day practice
Use this topic as a focused review, then test it in exam-style conditions with a free mock before deciding whether five full-length mocks are the right next step.
Start the Free BCBA Mock ExamContinue with Five Full-Length Mocks — $99
Review the included materials and access details before ordering. No pass guarantee is implied.



