
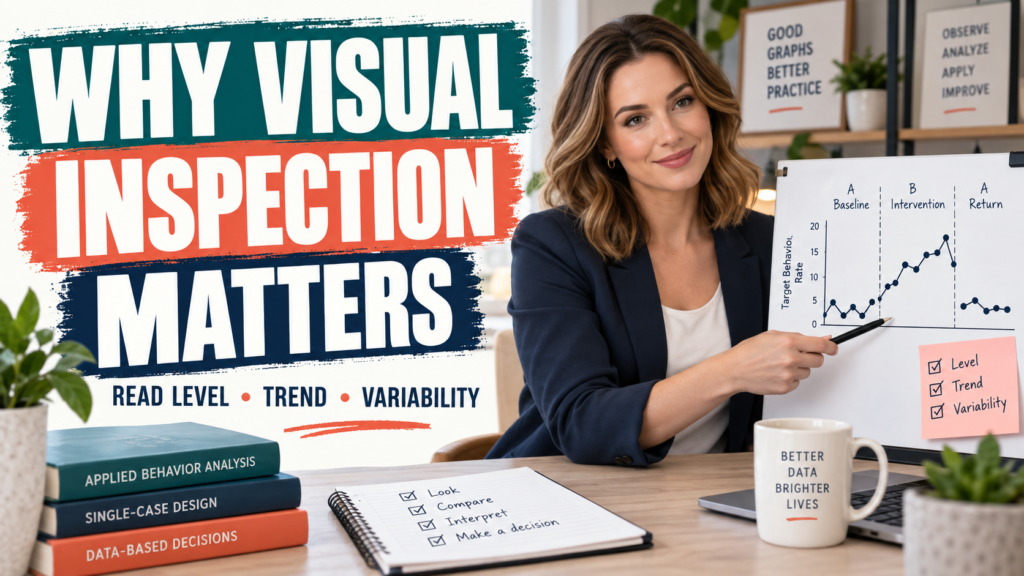
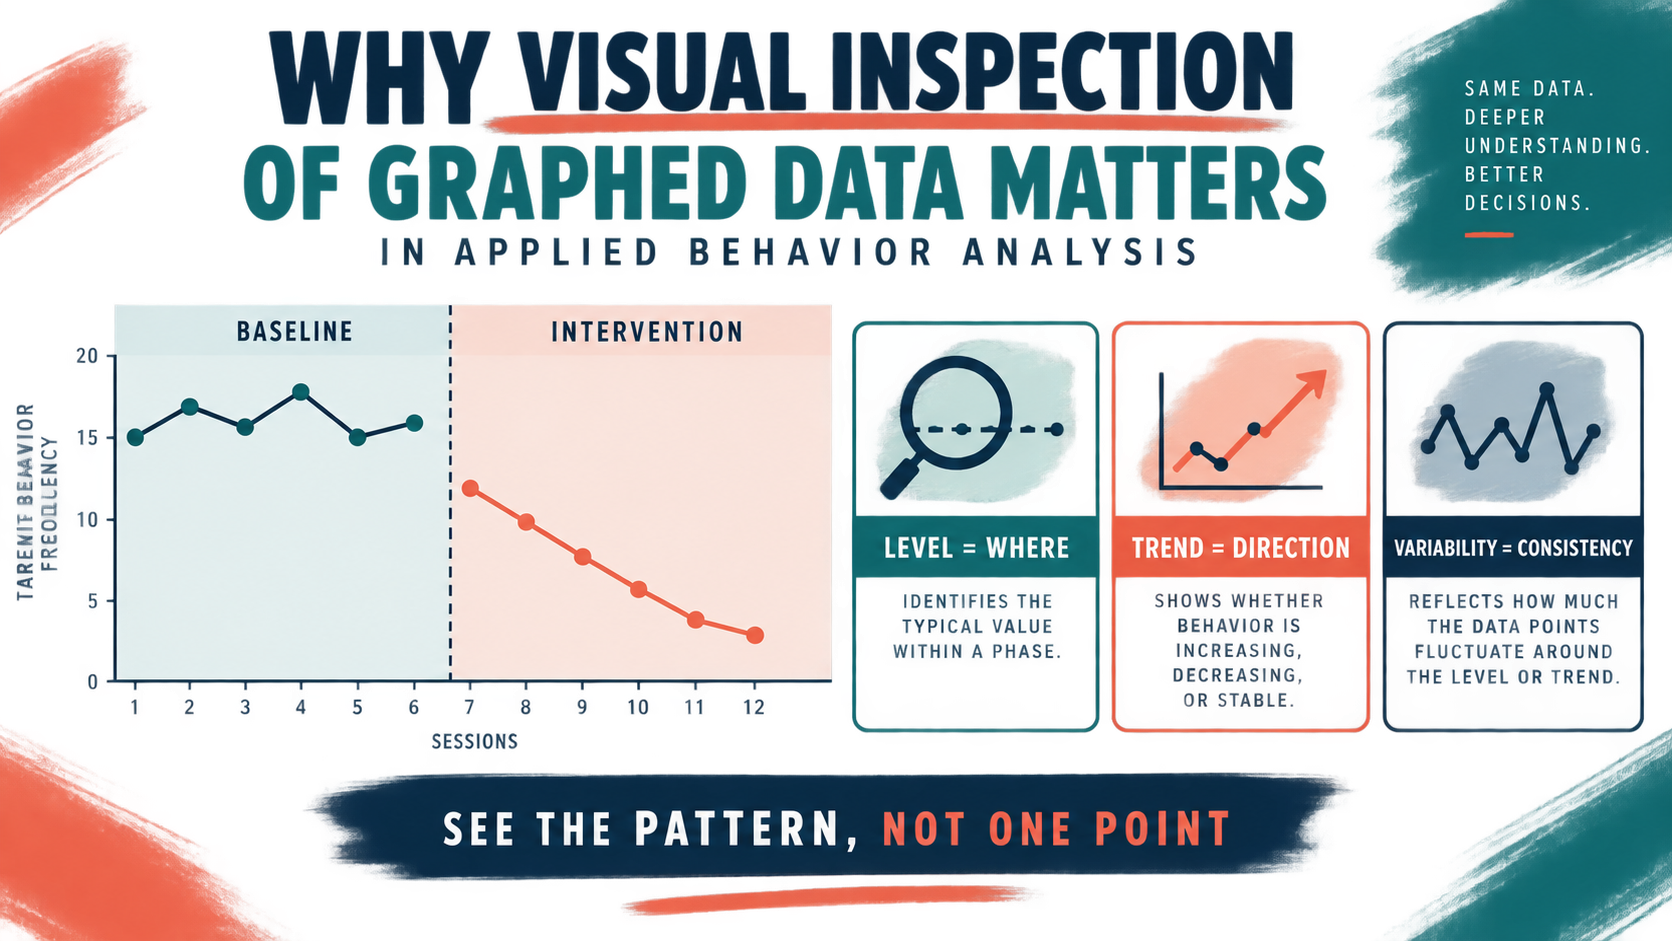
Why is visual inspection of graphed data important in ABA? Because a graph shows the pattern of behavior across time and conditions, not just one total or average. By inspecting the data path, a behavior analyst can evaluate level, trend, variability, the immediacy of change, overlap between phases, and whether the observed pattern is consistent enough to support a treatment decision.
Table of Contents
- Why Is Visual Inspection of Graphed Data Important in ABA?
- What Does Visual Inspection Reveal?
- Why Is the Single-Case Pattern Important?
- How Should You Read an ABA Graph?
- Why Can a Mean Be Misleading?
- What Are the Limits and Exam Traps?
- Quick Review Checklist
- Take the Free BCBA Mock Exam
- References
This matters especially in single-case behavior analysis. A learner’s behavior can change from session to session, and the same mean can be produced by a stable pattern or by extreme ups and downs. Visual inspection keeps those features visible. It helps the analyst ask whether a change occurred when the intervention was introduced, whether the change is replicated, and whether the result is meaningful for the client.
Visual inspection is not casual guessing and it is not permission to ignore data quality. The analyst first checks the measurement, graph, phase labels, and implementation context, then interprets the pattern using a systematic process. Table of Contents
Why Is Visual Inspection of Graphed Data Important in ABA?
Visual inspection is important because behavior-analytic decisions depend on changes in responding over time. A graph makes the relationship between observations, phases, and intervention conditions easier to see. Instead of asking only whether the average went down, the analyst can ask whether the data became lower immediately after the phase change, stayed lower, became less variable, or continued a trend that was already present during baseline. That information supports several practical decisions:
- Continue: the intervention appears effective, is implemented with integrity, and is producing socially meaningful change.
- Modify: the target is not improving enough, the pattern is unstable, or the plan is not producing the expected change.
- Reassess: the measurement, function, context, or intervention fidelity may not support a confident interpretation.
- Generalize or maintain: the behavior change is stable and should be tested across people, settings, materials, or time.
The current BCBA Test Content Outline includes graphing data to communicate quantitative relations, interpreting graphed data, and making data-based decisions about intervention effectiveness and procedural integrity. Visual inspection is therefore connected to measurement and treatment evaluation, not an optional decoration added to a report.
What Does Visual Inspection Reveal?
Three core features are tested often and should be read together:
| Feature | What to inspect | Why it matters |
|---|---|---|
| Level | The general height of data points within or between phases | Shows the typical magnitude of responding and whether a phase shift occurred |
| Trend | The overall direction of the data path: increasing, decreasing, or flat | Shows where behavior is heading and whether baseline was already changing |
| Variability | How much the data points fluctuate around their general path | Shows how predictable the response is and how confidently phases can be compared |
When conditions are compared, also inspect the immediacy of change after a phase line, the amount of overlap between phases, and consistency across repeated demonstrations. A treatment phase with a lower level but heavy overlap may provide a weaker signal than a phase with a clear, immediate, and replicated separation.
Why Is the Single-Case Pattern Important?
Single-case designs repeatedly measure one learner or unit across conditions. That repeated measurement creates a time series: the data point is not isolated from the points before and after it. Visual inspection helps the analyst evaluate whether a functional relation is plausible within the design.
Consider an AB design in which problem behavior is already decreasing during baseline. If the intervention begins and the behavior continues to decrease at roughly the same slope, the post-intervention improvement may reflect the existing baseline trend rather than a clear intervention effect. The analyst should not claim a strong effect only because the final data point is low.
Now consider a multiple-baseline or reversal design. If behavior changes when and only when the intervention is introduced or withdrawn according to the design, the pattern can provide stronger evidence of experimental control. Visual inspection helps identify that timing and replication. It also helps the analyst notice an unwanted effect, such as a replacement response improving while a dangerous side effect appears.
How Should You Read an ABA Graph?
Use a repeatable sequence rather than jumping straight to “worked” or “did not work.”
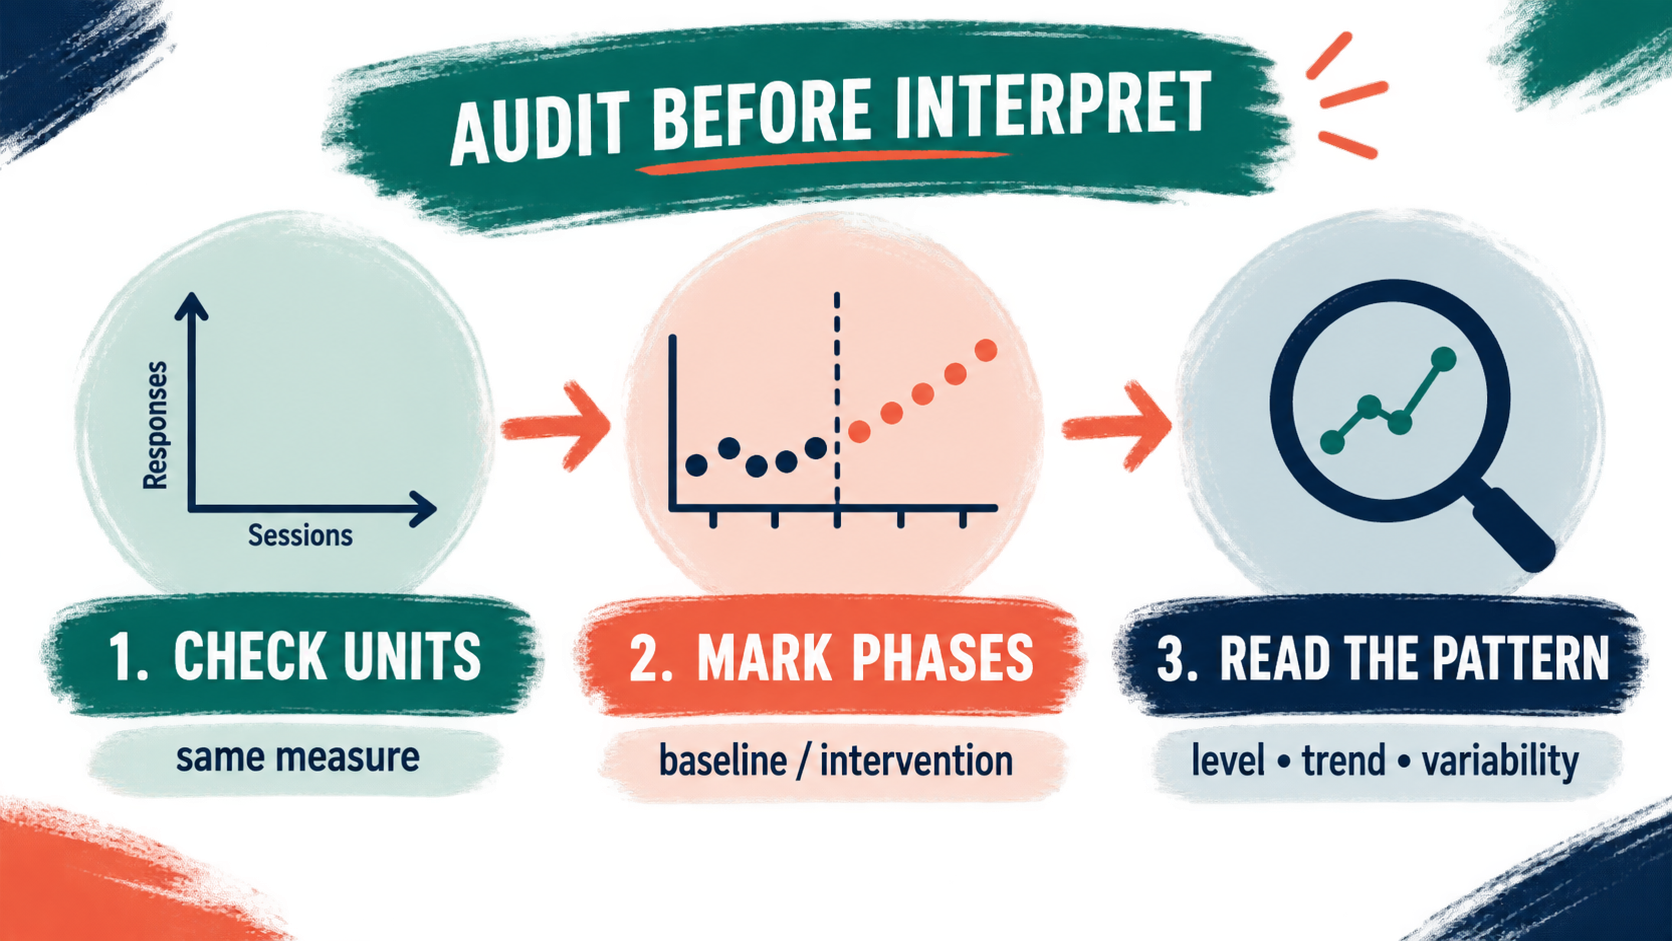
- Audit the display: read the y-axis label, units, scale, x-axis, phase labels, phase lines, and data-point definitions. Confirm that the graph represents the same measurement system across the comparison.
- Read within each phase: describe the level, trend, and variability during baseline and each intervention condition before comparing them.
- Compare at the phase change: inspect immediacy, level shift, overlap, and whether the new pattern is moving in the desired direction.
- Check replication: look for the same relationship in later phases, settings, people, or targets when the design provides those demonstrations.
- Add implementation and context: check procedural integrity, staffing, schedule, health or environmental changes, and the client’s experience before making a modification.
- Document the decision rule: state what will happen next, what data will be collected, and when the team will review the result again.
This sequence prevents a common error: interpreting a visual pattern without checking whether the data were collected reliably. If interobserver agreement is poor, the graph may look variable because observers disagreed. If a phase was implemented inconsistently, a flat pattern may reflect treatment integrity rather than treatment failure.
Why Can a Mean Be Misleading?
A mean summarizes a set of values, but it removes the order and shape of those values. Suppose baseline data are 2, 2, 2, 2, 2 and intervention data are 0, 4, 0, 4, 0. Both phases can have different clinical meanings even if a simple average makes them appear similar. The intervention pattern may show high variability and poor predictability, not stable improvement.
Another example is a baseline sequence of 10, 9, 8, 7 followed by intervention data of 6, 5, 4, 3. The lower intervention values look promising, but the same decreasing trend was already present. Visual inspection tells the analyst to consider the preexisting trend and the design before attributing the entire change to the intervention.
Visual inspection does not mean “ignore numbers.” The analyst uses the numbers, graph, measurement reliability, and relevant quantitative summaries together. Objective methods can complement visual analysis when appropriate, especially when the pattern is ambiguous. The decision should remain tied to the client’s goals, safety, and meaningful outcomes.
What Are the Limits and Exam Traps?
- One low point proves success: a single point is not a stable trend or replicated treatment effect.
- Any downward trend means the intervention worked: the downward trend may have started during baseline.
- Low variability is always good: stable high rates of dangerous behavior are not a successful outcome.
- A mean replaces the graph: the mean hides order, immediacy, overlap, and variability.
- Visual inspection replaces fidelity checks: a graph cannot tell you whether the intervention was implemented as designed without additional fidelity data.
- Visual inspection is subjective guessing: it is a systematic examination of graphed data, but analysts should use clear definitions, decision rules, training, and supporting information.
So, why is visual inspection of graphed data important in ABA? It converts a list of measurements into a defensible view of how behavior changes across time and conditions. It helps the analyst see the pattern, test whether the timing and consistency support a conclusion, and choose the next step without letting one average or one data point decide the case. For exam preparation, practice identifying level, trend, variability, phase changes, and procedural-integrity clues in short scenarios. Our free BCBA mock exam can help you rehearse these data-based decisions under time pressure. Try the Free BCBA Mock Exam For targeted review, use our visual inspection of graphed data practice questions to apply the concept in exam-style scenarios.
Quick Review Checklist
Use this final checklist to turn visual inspection of graphed data into exam-ready reasoning. The goal is not to memorize a label in isolation; it is to identify the relevant evidence and explain why the best answer fits the scenario. Key ideas to review:
- State the central definition or decision point for visual inspection of graphed data in your own words.
- Identify the detail that makes visual inspection of graphed data different from its closest related ABA term.
- Separate the observable facts in a scenario from assumptions that are not supported by the facts.
- Write one example and one nonexample so you can recognize the concept in a new setting.
Exam application checks:
- Ask what the question is actually requesting before comparing the answer choices.
- Mark the antecedent, response, consequence, or other evidence that supports the selected answer.
- Look for a distractor that describes a related process but does not answer the specific question.
Final self-check:
- Explain how you would verify the interpretation with clear observations or data.
- Change one detail in the scenario and decide whether your answer should change.
- Give a one-sentence rationale that a supervisor or study partner could evaluate.
Take the Free BCBA Mock Exam
If you want a low-pressure way to check your recall, use the free practice resource below. Take the Free BCBA Mock Exam
References
- BACB BCBA Test Content Outline, 6th Edition
- BACB RBT Test Content Outline, 3rd Edition
- Evaluation of Computer-Based Training to Teach Visual Analysis Skills
- Agreement Between Visual Inspection and Objective Analysis Methods
- Consistent Visual Analyses of Intrasubject Data
- Passage Health: ABA Graphs and Data Interpretation



