

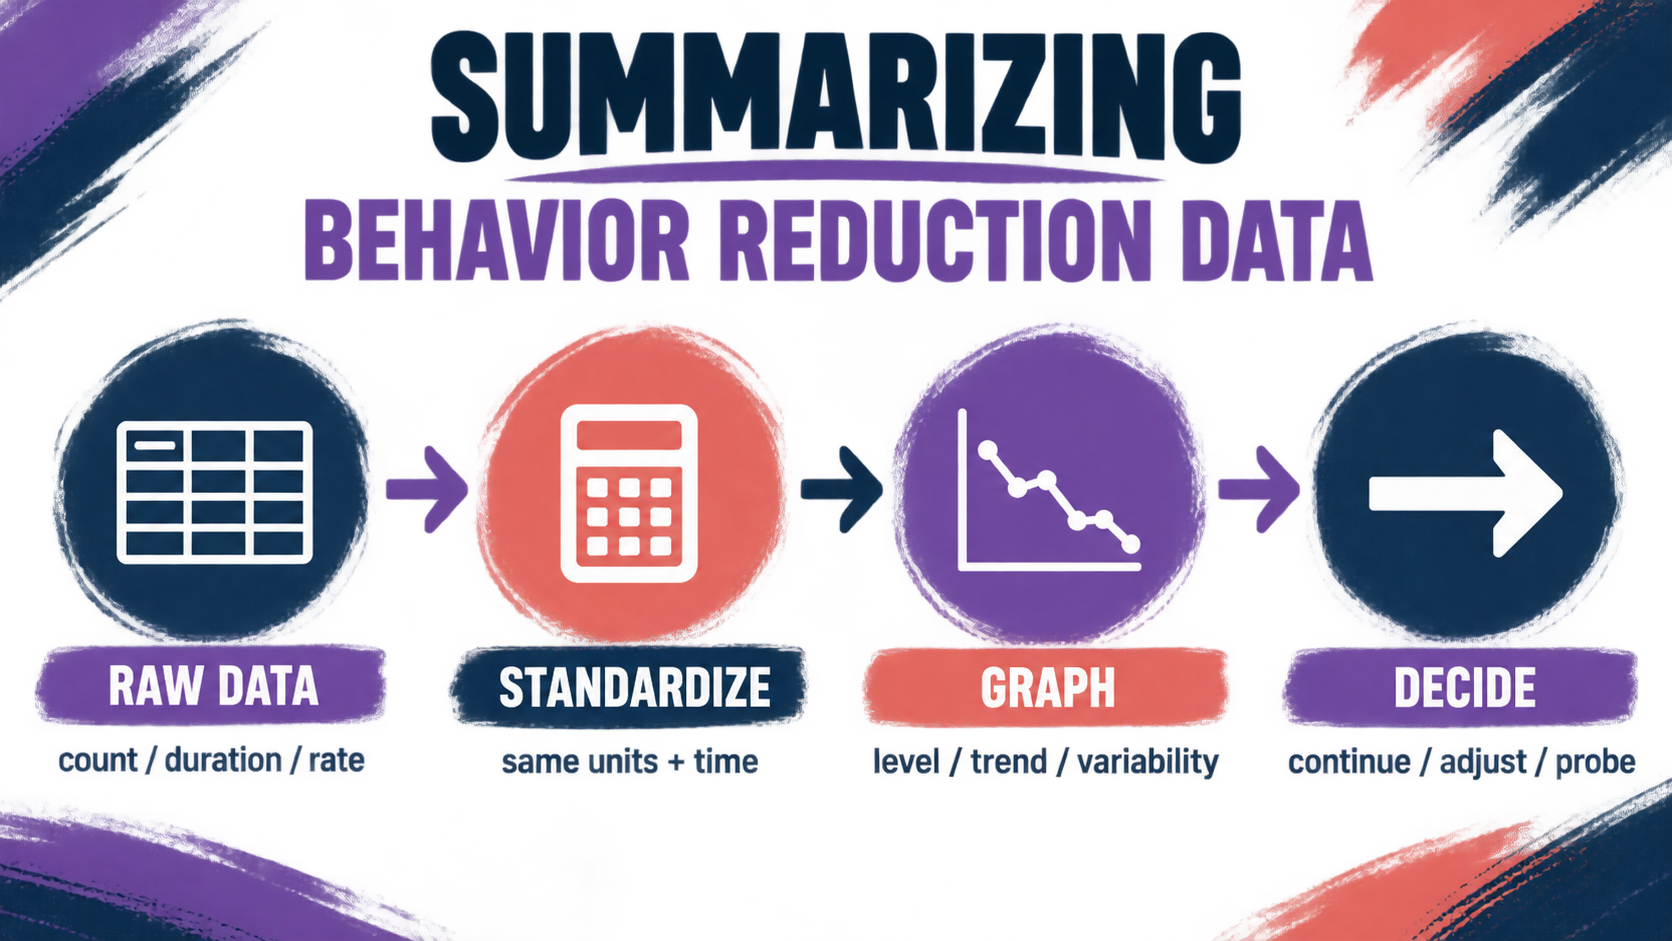
If you are asking what does summarizing behavior reduction data entail, the short answer is: convert raw observations into a clear, comparable description of the target behavior so a behavior analyst can interpret change and make a data-based decision. Summarizing is more than copying session notes. It means selecting an appropriate unit, organizing the observations, calculating useful descriptive values, and presenting the result without changing what the data actually show.
Table of Contents
- What Does Summarizing Behavior Reduction Data Entail?
- How Do Raw Observations Become a Summary?
- Which Calculations Are Commonly Used?
- What Does a Worked Example Look Like?
- How Is Summarizing Different From Visual Inspection?
- What Are Common Exam Traps?
- Take the Free BCBA Mock Exam
- References
For a behavior-reduction program, the summary should help answer questions such as: How often did the behavior occur? Was the observation period the same each day? Did the rate change after intervention? Is the pattern stable enough to support a decision? A good summary preserves context while making the important comparison easier to see. This guide is written for BCBA exam preparation and data-literacy practice. A real clinical decision also requires a valid operational definition, reliable measurement, appropriate graphing, client-centered goals, and qualified clinical judgment. Table of Contents
What Does Summarizing Behavior Reduction Data Entail?
Summarizing behavior-reduction data entails reducing a set of observations to meaningful descriptive information while keeping the measurement system and context visible. The summary may include a total count, rate, percentage, duration, mean, range, or another value that fits the dimension of the behavior and the question being asked.
For example, “the learner had 24 episodes” is incomplete if one session lasted 30 minutes and another lasted 3 hours. A rate such as 8 episodes per hour may be more comparable. Likewise, “the behavior occurred on 40% of trials” requires the reader to know the number and definition of the opportunities. The calculation does not make the data better; it makes the unit explicit. A strong summary usually does four things:
- Preserves the behavior definition: summarize the operationally defined target, not a vague label such as “bad behavior.”
- Uses a fitting dimension: choose count, rate, duration, latency, percentage, or another measure that matches the behavior and observation plan.
- Standardizes the comparison: account for session length, number of opportunities, phase, setting, and relevant changes in the observation procedure.
- Supports a decision: present enough information to evaluate progress, treatment effectiveness, procedural integrity, or the need for more assessment.
How Do Raw Observations Become a Summary?
Start with the raw record and ask what the reader needs to compare. A raw record might include the date, setting, session length, count of episodes, total duration, number of opportunities, and the intervention phase. Do not calculate first and inspect the measurement system later. If the observation periods or definitions changed, a neat average can create a misleading comparison.
| Raw information | Possible summary | Question it helps answer |
|---|---|---|
| Episodes observed and observation time | Rate per hour or per session | Did frequency change when exposure time differed? |
| Total seconds and number of episodes | Total duration or mean duration per episode | Did the behavior last less time, even if it still occurred? |
| Responses and available opportunities | Percentage of opportunities | How often did the response occur relative to chances to respond? |
| Values across sessions or phases | Mean, median, range, or phase summary | What is typical, and how variable are the observations? |
Next, label the phase and conditions. A mean from baseline should not be quietly combined with a mean from intervention if the purpose is to compare phases. Summaries should make the comparison visible: “baseline rate,” “intervention rate,” “home,” “clinic,” or another meaningful label.
Which Calculations Are Commonly Used?
The correct calculation depends on the measurement system. These are common examples:
- Count: the number of observed responses. A count is most interpretable when observation opportunities and time are comparable.
- Rate: count divided by observation time. If 18 episodes occur in 3 hours, the rate is 18 ÷ 3 = 6 episodes per hour.
- Percentage: responses divided by opportunities, multiplied by 100. If a learner responds independently on 12 of 20 opportunities, the percentage is 12 ÷ 20 × 100 = 60%.
- Total duration: add the seconds or minutes the behavior occurred. This is useful when a reduction in episode length matters, not only episode count.
- Mean duration: total duration divided by the number of episodes. If episodes lasted 30, 20, and 10 seconds, the mean duration is 60 ÷ 3 = 20 seconds.
- Range: highest value minus lowest value, or a stated minimum-to-maximum span. Range helps describe variability but does not replace a graph or phase comparison.
Do not select a calculation because it produces the smallest number. Select it because it represents the behavioral dimension and observation conditions. A percentage can look improved when the number of opportunities changes, and a count can look improved when the observation period becomes shorter. The denominator is part of the result.
What Does a Worked Example Look Like?
Imagine that a target behavior is recorded during two-hour sessions. During four baseline sessions, the counts are 12, 10, 14, and 12. The baseline total is 48 episodes across 8 hours, so the baseline rate is 48 ÷ 8 = 6 episodes per hour.
During four intervention sessions of the same length, the counts are 8, 6, 7, and 5. The intervention total is 26 episodes across 8 hours, so the intervention rate is 26 ÷ 8 = 3.25 episodes per hour. A simple descriptive comparison suggests a lower average rate, but it does not by itself prove that the intervention caused the change. The analyst still reviews the phase graph, procedural integrity, contextual changes, and the quality of the measurement.
If the intervention sessions had lasted only one hour each, the intervention rate would instead be 26 ÷ 4 = 6.5 episodes per hour. The raw count would look lower, but the standardized rate would not support the same conclusion. This is why summarizing behavior reduction data entails checking time and opportunity denominators before describing progress.
How Is Summarizing Different From Visual Inspection?
Summarizing produces organized descriptive values. Visual inspection interprets the pattern displayed across data points and phases. They work together but are not interchangeable.
- Summarizing asks: What is the count, rate, percentage, duration, mean, or range in each relevant condition?
- Visual inspection asks: What are the level, trend, variability, immediacy of change, overlap, and consistency across phases?
- Data-based decision making asks: Is the pattern strong and socially meaningful enough to continue, modify, generalize, or reassess the intervention?
For example, two phases can have the same mean but very different patterns. One may be stable at the mean while the other alternates between very high and very low values. A mean alone hides that variability. Conversely, a graph without clear units or phase labels can make a trend look persuasive even when the measurement changed halfway through the program. The BCBA Test Content Outline connects measurement, data display, interpretation, intervention effectiveness, and procedural integrity. A summary is therefore a tool for communication and decision making, not a substitute for the complete analysis.
What Are Common Exam Traps?
- Using count when exposure time differs: calculate a rate or otherwise make the time difference explicit.
- Confusing percentage with rate: percentage uses opportunities; rate uses time.
- Calculating a mean before checking the phase: do not blend baseline and intervention values when the comparison matters.
- Calling a lower count proof of treatment effect: review graph patterns, fidelity, alternative explanations, and social significance.
- Ignoring measurement reliability: a precise summary of unreliable observations remains unreliable.
- Replacing the operational definition with a label: the data must refer to observable, measurable behavior.
When a question asks what summarizing behavior reduction data entails, look for the answer that organizes and calculates the observations in a fitting, comparable form. It should preserve the unit, phase, and context, then support—not replace—visual analysis and data-based decisions. Once you understand the data workflow, practice applying it to short scenarios. Our free BCBA mock exam can help you rehearse measurement, intervention, and ethics decisions under time pressure. Try the Free BCBA Mock Exam
Take the Free BCBA Mock Exam
If you want a low-pressure way to check your recall, use the free practice resource below. Take the Free BCBA Mock Exam
References
- BACB BCBA Test Content Outline, 6th Edition
- BACB RBT Test Content Outline, 3rd Edition
- BACB Test Content Outlines for Certifications
- Behaviorist Book Club: ABA Data Collection and Analysis
- Systematic Protocols for Visual Analysis of Single-Case Research Data
- Passage Health: ABA Graphs and Data Interpretation



