
A task analysis graph turns step-by-step teaching data into a pattern the team can interpret. The right display shows whether performance is improving across steps, whether prompts are fading, and whether the skill generalizes beyond the training routine.
Table of Contents
- What Does a Task Analysis Graph Show?
- How Do You Choose the Data Unit?
- How Do You Build a Task Analysis Graph?
- How Do You Interpret Overall and Step-Level Change?
- How Does the Graph Show Generalization?
- What Mistakes Should You Avoid?
- What Does the BCBA Exam Ask About Task Analysis Data?
- What Is the Bottom Line?
- Quick Review Checklist
- Take the Free BCBA Mock Exam
A task analysis graph displays data from a skill broken into observable steps. The team may graph the percentage of steps completed independently, the number of steps correct, prompt levels, or performance for each step across sessions. The graph is useful only when the task analysis, scoring rule, and teaching condition are defined clearly.
For example, “make a sandwich” may include gathering materials, opening the container, placing the bread, adding ingredients, closing the container, and cleaning the area. A learner can have a high overall percentage while one safety-critical step remains dependent on a prompt. Step-level information protects the team from treating an average as the whole skill.
What Does a Task Analysis Graph Show?
The graph can answer different questions. A session-level graph of independent steps shows whether overall independence changes over time. A step-by-step matrix shows which components are strong or weak. A prompt-level graph shows whether the learner performs the sequence with less assistance. A generalization graph compares performance across people, settings, materials, or routines.
Choose one primary question for the display. Mixing every score into one line can make the graph hard to interpret. The BCBA Test Content Outline supports defining behavior and using data to guide decisions, not collecting numbers without a decision rule.
How Do You Choose the Data Unit?
Decide whether a step is scored as independent, prompted, incorrect, or not completed. If the goal is independence, the primary data may be the percentage of steps completed without assistance. If the goal is accuracy regardless of prompt, prompted-correct may be included in a different measure. Do not switch scoring rules halfway through the graph.
| Graph option | Best question | Caution |
|---|---|---|
| Percent independent steps by session | Is overall independence improving? | An average can hide one weak step |
| Step-by-step matrix | Which steps need teaching? | Large matrices can be hard to read without clear labels |
| Prompt-level graph | Is assistance fading? | Lower prompts do not prove generalization |
| Generalization graph | Does the sequence transfer? | Settings and materials must be named |
How Do You Build a Task Analysis Graph?
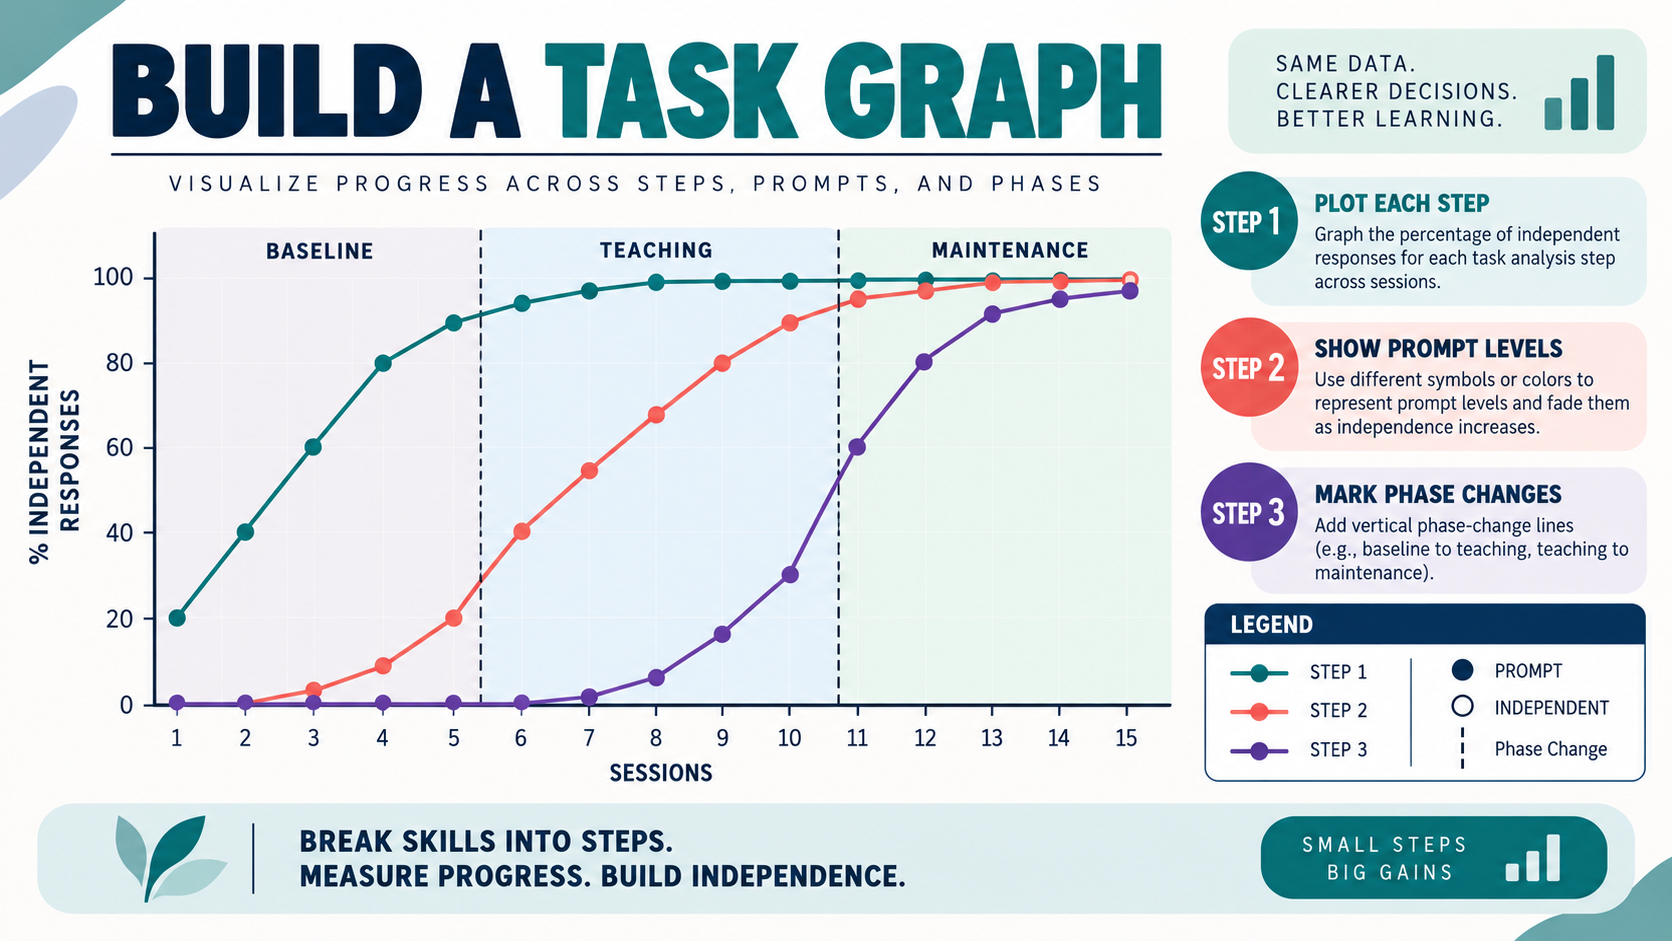
List the steps in a stable order and define the scoring rule. For each session, record the number of independent steps and the total number of applicable steps. Calculate the percentage as independent steps divided by applicable steps, multiplied by 100. If a step is skipped because the material was unavailable, document it rather than silently changing the denominator.
Put sessions or dates on the x-axis and the selected measure on the y-axis. Label baseline, teaching, probe, maintenance, or generalization phases. When the teaching procedure changes, draw a phase line and keep the condition labels visible. If step-specific data are important, use a second display or a table rather than overloading the overall graph.
How Do You Interpret Overall and Step-Level Change?
Compare level, trend, variability, and immediacy across phases. A rising percentage of independent steps may indicate progress, but inspect which steps changed. If the score moves from 40% to 80% because four easy steps improved while a dangerous step remains at zero, the clinical decision should focus on that step rather than the average alone.
Look for prompt patterns. A learner may complete the sequence only when the therapist gives a model, or may start independently but need a prompt at the final step. Prompt data can reveal whether the intervention is producing independence or merely producing correct performance under assistance.
How Does the Graph Show Generalization?
Keep training and generalization conditions identifiable. A learner may complete a handwashing routine in the clinic with one sink but not in a public restroom or at home. Graphing all settings together can hide that difference. Separate series or panels can show whether the task transfers to new materials, people, instructions, and natural consequences.
Generalization should be planned, not assumed from a high training score. Probe the skill under the conditions that matter to the person’s life, while preserving safety and access. If a prompt is needed in the new setting, record it instead of calling the response independent.
What Mistakes Should You Avoid?
- Graphing only the average: step-level weakness can disappear inside a high overall percentage.
- Changing the task analysis silently: adding or removing steps changes the denominator and breaks comparisons.
- Counting prompted steps as independent: prompt level must match the goal.
- Ignoring materials: different materials can change the task and the response requirement.
- Calling clinic success generalization: new settings and people require direct probes.
- Connecting data across conditions: phase lines and labels show when teaching changed.
What Does the BCBA Exam Ask About Task Analysis Data?
Read the denominator and the scoring rule. If a stem says a learner completed 8 of 10 steps independently, the percentage is 80%; if two steps were omitted because they were not applicable, ask whether the total should be 8 rather than 10. If the question asks whether a learner has generalized, look for data from a new person, place, stimulus, or response requirement.
Also separate acquisition from fluency and maintenance. A high score during intensive teaching does not necessarily mean the skill persists over time or occurs efficiently. A well-labeled task analysis graph helps identify the exact claim supported by the data.
What Is the Bottom Line?
A task analysis graph is strongest when it shows the measure, denominator, prompt rule, phase, and step-level meaning. Use the overall line for the broad decision, then inspect the individual steps before changing instruction. For more practice with skill acquisition and data interpretation, use the free BCBA mock exam. It is a study aid, not a replacement for individualized programming or supervision.
For targeted review, use our task analysis graph practice questions to apply the concept in exam-style scenarios.
Quick Review Checklist
Use this final checklist to turn task analysis graph into exam-ready reasoning. The goal is not to memorize a label in isolation; it is to identify the relevant evidence and explain why the best answer fits the scenario. Key ideas to review:
- State the central definition or decision point for task analysis graph in your own words.
- Identify the detail that makes task analysis graph different from its closest related ABA term.
- Separate the observable facts in a scenario from assumptions that are not supported by the facts.
- Write one example and one nonexample so you can recognize the concept in a new setting.
Exam application checks:
- Ask what the question is actually requesting before comparing the answer choices.
- Mark the antecedent, response, consequence, or other evidence that supports the selected answer.
- Look for a distractor that describes a related process but does not answer the specific question.
Final self-check:
- Explain how you would verify the interpretation with clear observations or data.
- Change one detail in the scenario and decide whether your answer should change.
- Give a one-sentence rationale that a supervisor or study partner could evaluate.
Take the Free BCBA Mock Exam
When you are ready to apply the idea, use the free practice resource below for additional feedback. Take the Free BCBA Mock Exam