
If you searched for split middle line of progress ABA, you are looking for a way to estimate the overall trend of data on a behavior-analytic graph. The method divides a phase into two parts, identifies the middle rate and middle date for each half, connects the resulting intersections, and then adjusts the line so the data are balanced above and below it. It is a visual-analysis tool—not proof that an intervention caused change.
Table of Contents
- What Is Split Middle Line of Progress ABA?
- How Does the Split-Middle Method Work?
- How Do You Draw a Split-Middle Line of Progress?
- What Does the Line Tell You?
- How Is It Different From Other Trend Lines?
- What Mistakes Should You Avoid?
- How Should You Study It for the BCBA Exam?
- Frequently Asked Questions
- Sources for Further Study
- Take the Free BCBA Mock Exam
The split-middle method is most useful when you already have an appropriate graph and a clearly defined phase. It should be interpreted alongside level, trend, variability, immediacy of change, overlap, and replication. For current BCBA study scope, use the BACB Test Content Outline and task-list resources. The worked examples here are original study illustrations, not official BACB questions.
What Is Split Middle Line of Progress ABA?
A split-middle line of progress is a trend line drawn through a series of data points. “Split-middle” describes the construction: the data in one phase are split into two halves, and the middle values of each half are used to establish the line’s direction. The final line is shifted parallel to the initial line of progress until an equal number of points fall above and below it, when the graph and data allow that balance.
In ABA, the line summarizes the general direction of a data path. An upward line suggests an increasing trend; a downward line suggests a decreasing trend; a relatively flat line suggests little directional change. The line does not replace the data points, and it does not tell you whether a behavior is socially important, whether an intervention is ethical, or whether an experimental relation has been demonstrated.
It also should not be confused with a phase-change line. A phase-change line is a vertical marker showing when the condition or intervention changed. A split-middle line of progress is a trend estimate drawn within a phase or data series. One describes the structure of the graph; the other summarizes a pattern within the data.
How Does the Split-Middle Method Work?
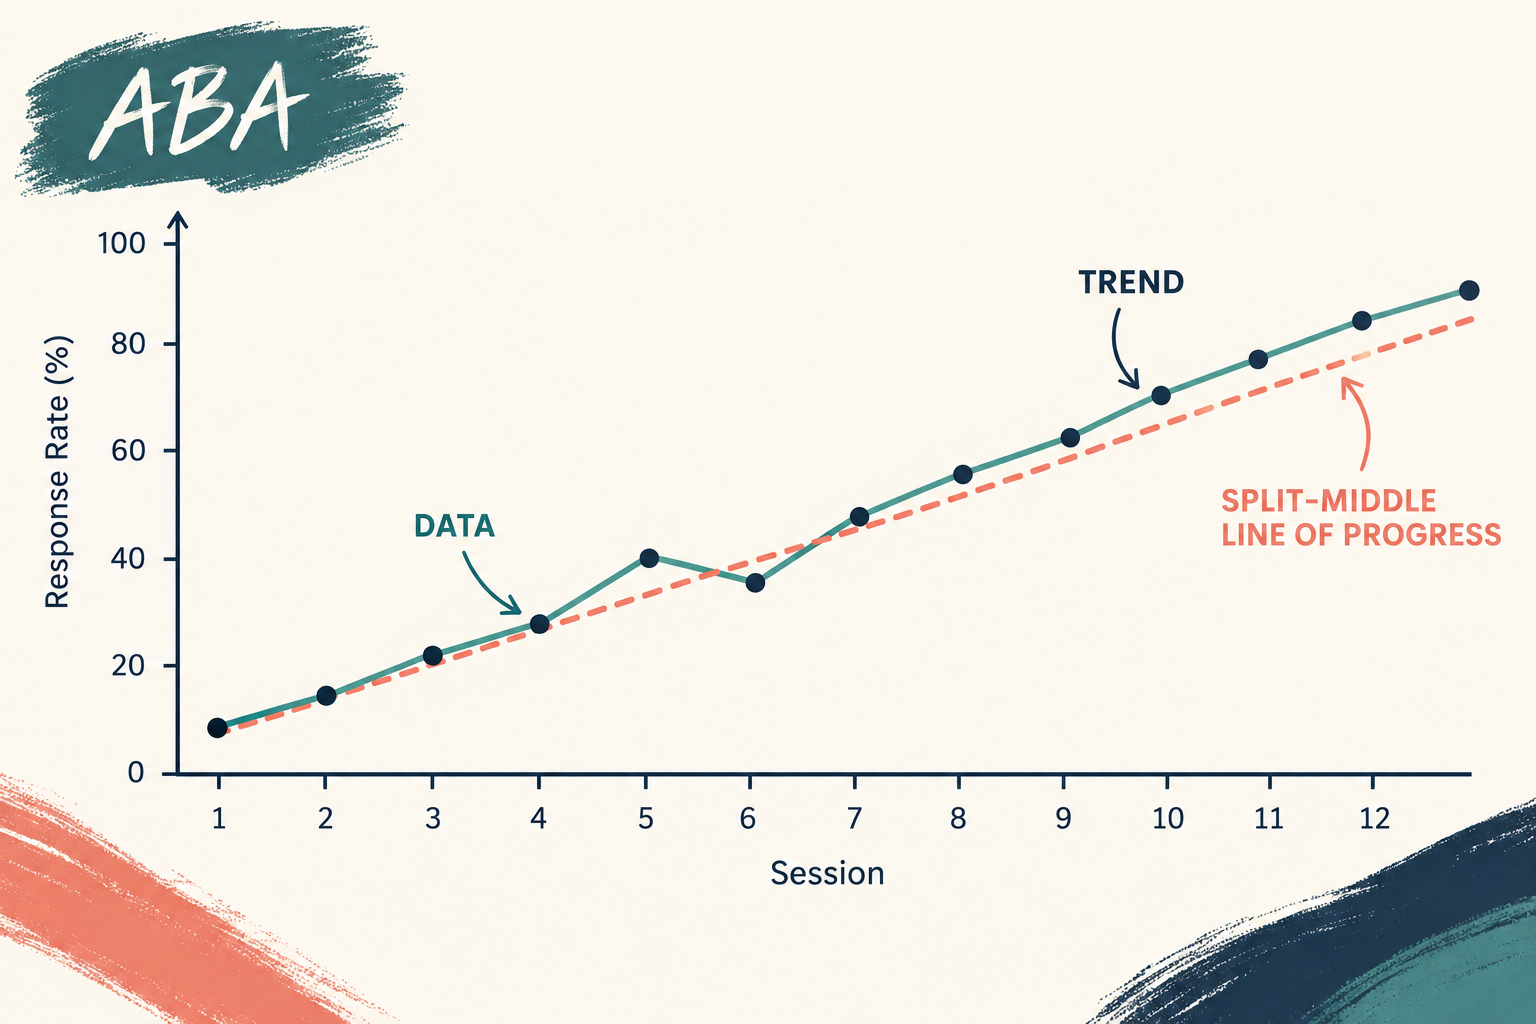
The method is a structured way to reduce the subjectivity of simply looking at a cloud of points and drawing a line by eye. It is still an estimate, however. It does not transform a small or highly variable data set into precise evidence. Before drawing it, confirm that the data points belong to one comparable phase and that the horizontal axis represents time or another ordered sequence.
| Term | Meaning in the method | Exam reminder |
|---|---|---|
| Phase | A set of data collected under the same relevant condition or phase of a single-case design. | Do not combine incomparable conditions just to produce a nicer line. |
| Mid-rate | The middle response-rate value for each half of the phase; if two values occupy the middle, use the appropriate midpoint convention. | It is a y-value, not the middle session number. |
| Mid-date | The middle x-value or session position for each half of the phase. | It locates the midpoint in time, not the average response rate. |
| Quarter-intersect line | The line connecting the two intersections formed by the mid-date and mid-rate points. | It provides the initial direction for the final split-middle line. |
Many learners remember the sequence as count, divide, mid-rate, mid-date, quarter, split. The mnemonic is useful only if the graph’s axes, phase boundaries, and data order have already been identified correctly.
How Do You Draw a Split-Middle Line of Progress?
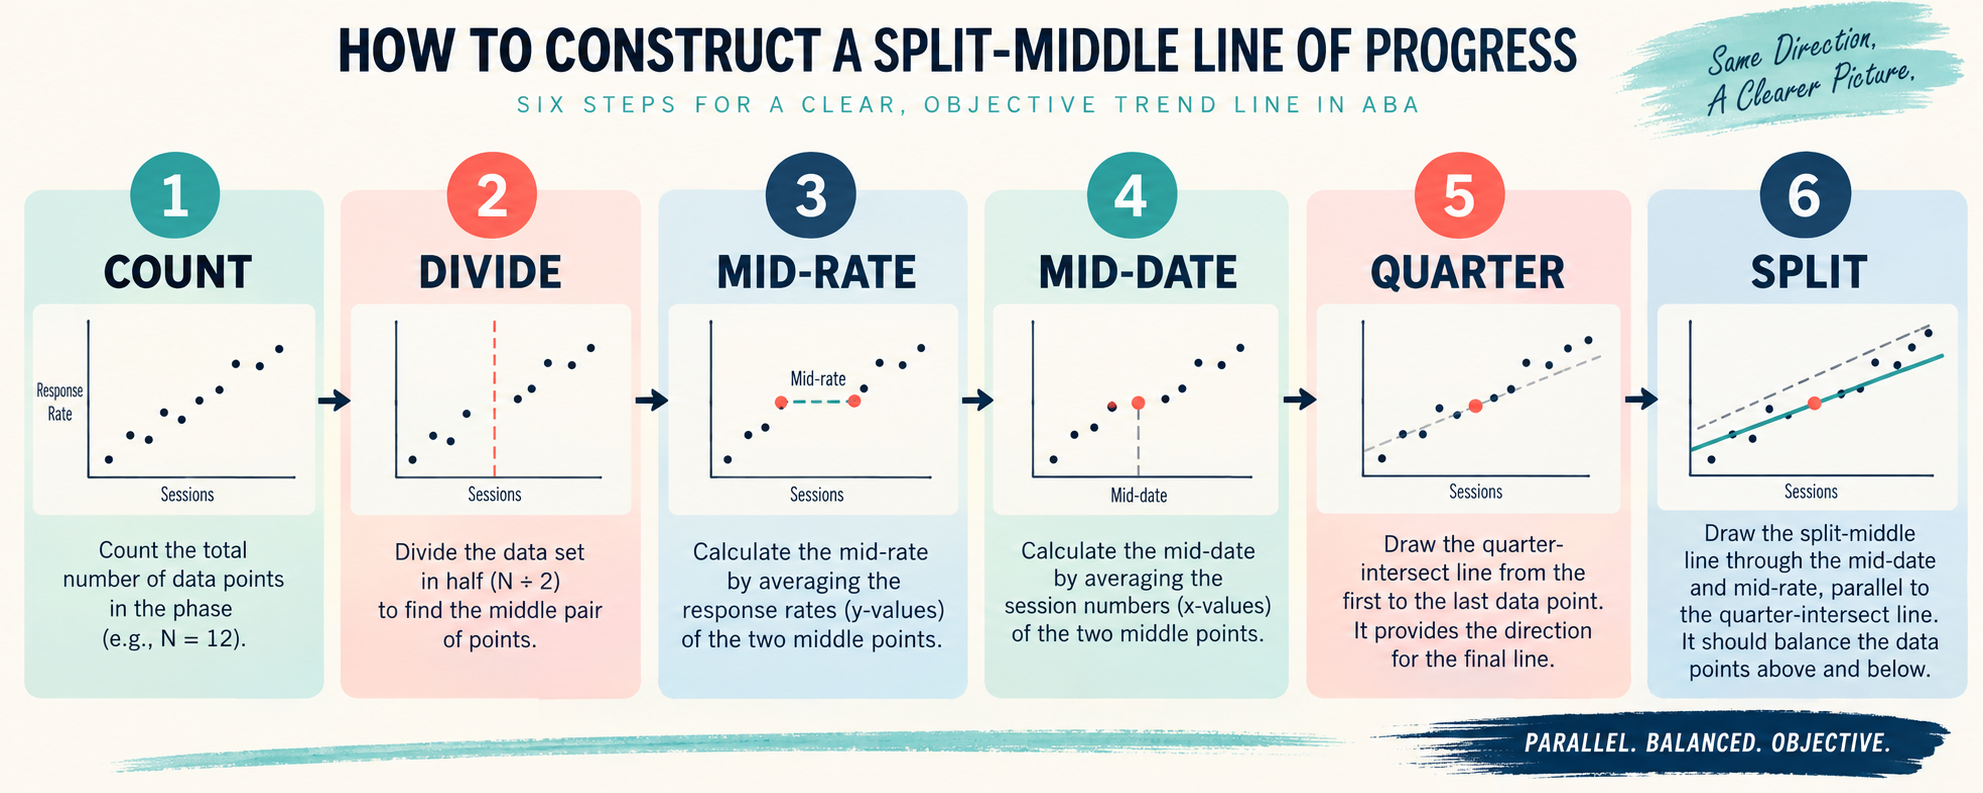
Use the following sequence for a single phase. The exact drawing may look different when there are missing values, an uneven number of observations, or a scale that is not appropriate for the method, so follow the convention specified by your course or source.
- Count the points: Count the data points in the phase, not the number of sessions written on the entire graph. Mark missing data rather than treating a blank as zero.
- Divide the phase: Use a vertical division to separate the ordered data into two halves. With an odd number of points, use the convention given in the problem or instructional source.
- Find each mid-rate: Within each half, order the response-rate values and identify the middle value. If there are two middle values, calculate their midpoint when that is the stated rule.
- Find each mid-date: Identify the middle session or x-axis position for each half. The mid-date is based on the ordered positions of the points.
- Plot the intersections: Pair each half’s mid-date with its mid-rate. Connect those two coordinates to form the quarter-intersect line of progress.
- Split the line: Shift the line parallel to itself, when necessary, so the final line balances the points above and below it. Keep the slope; adjust the position.
Imagine a phase with twelve ordered data points. You divide the series into two groups of six, calculate the middle rate for each group, locate the middle session position for each group, and connect the two resulting coordinates. If the provisional line leaves noticeably more points on one side, move it up or down without changing its direction. The final line is a compact description of the phase’s trend, not a fitted regression equation.
What Does the Line Tell You?
The main question is whether the direction of the line is consistent with the visual pattern in the raw data. A steep upward line can indicate a strong increasing trend, but you should inspect variability and outliers before drawing that conclusion. A shallow line may represent stable performance, gradual change, or too much scatter to interpret confidently.
- Level: Around what value do the points cluster within the phase?
- Trend: Is the overall direction increasing, decreasing, or approximately zero?
- Variability: How much do the points bounce around the trend line?
- Immediacy: Did the pattern change quickly after a phase change?
- Overlap: How much do points in adjacent phases share the same range?
- Replication: Does a similar pattern appear when the design provides another opportunity to test the relation?
For example, if correct responses rise during an intervention phase, a positive split-middle trend may support the description “performance is increasing.” It does not by itself prove that the intervention produced the increase. If problem behavior falls, a downward line may be desirable, but you still need to consider measurement quality, competing changes, treatment integrity, and whether a socially meaningful replacement skill is developing.
How Is It Different From Other Trend Lines?
A freehand trend line is drawn by visual judgment. A least-squares regression line is calculated mathematically to minimize a particular pattern of error. A split-middle line uses the middle values of two halves and a parallel adjustment to summarize the direction. These methods can produce different-looking lines, especially with outliers or nonlinear data.
| Method | Strength | Limit |
|---|---|---|
| Freehand line | Fast and intuitive for an initial visual inspection. | More vulnerable to personal judgment and selective attention. |
| Split-middle line | Provides a repeatable hand-drawn estimate that is less driven by one extreme point. | Still summarizes a phase and should not be treated as a causal test or exact model. |
| Regression line | Uses a formal calculation that can be reproduced with statistical software. | May be outside the task being tested and can be misleading if the data structure or phase is inappropriate. |
On a BCBA exam, answer the method named in the stem. Do not replace a requested split-middle construction with a regression calculation just because software can draw one. Conversely, do not use a split-middle line to make a claim that requires experimental control or a more complete analysis.
What Mistakes Should You Avoid?
- Mixing phases: Do not draw one trend line across a vertical phase-change boundary when the question asks for a within-phase line.
- Confusing mid-rate and mid-date: The rate is a y-axis value; the date is an x-axis position.
- Changing slope during the split: The final line is shifted parallel to the quarter-intersect line; it is not redrawn with a new direction.
- Treating missing data as zero: A missing observation is not automatically a zero response.
- Over-reading one line: A trend estimate cannot establish function, treatment integrity, social validity, or causation by itself.
- Ignoring the graph scale: A broken axis or unequal spacing can change how a line appears and whether the construction is appropriate.
For a broader visual-analysis refresher, compare this focused method with the site’s ABA level, trend, and variability guide. Keep the pages distinct: that guide owns the larger interpretation framework, while this article owns the split-middle construction task.
How Should You Study It for the BCBA Exam?
First identify whether the question asks for a definition, a construction sequence, a trend interpretation, or a design conclusion. If it asks how to draw the line, look for count, divide, mid-rate, mid-date, quarter-intersect, and parallel split. If it asks what the line means, describe general direction and then inspect level, variability, and the relation between phases.
- Label the x-axis and y-axis before calculating anything.
- Circle the phase being analyzed and exclude data from other conditions.
- Separate x-values from y-values: mid-date locates time, and mid-rate summarizes responding.
- Remember that the final split-middle line keeps the quarter-intersect slope.
- Reject an answer that treats a trend line as proof of causation without experimental control.
For additional practice with data-reading scenarios, the free BCBA mock exam can provide study questions. It is not official BACB content and does not replace the current BACB outline.
Frequently Asked Questions
What is a split-middle line of progress used for?: It is used to summarize the overall trend of ordered behavioral data within a phase. It helps make a hand-drawn trend estimate more repeatable than an entirely freehand line.
Is a split-middle line the same as a phase-change line?: No. A phase-change line is usually vertical and marks a change in condition. A split-middle line is a trend estimate drawn through data within a phase. What does mid-rate mean?: Mid-rate is the middle response-rate value for one half of the data series. It is a y-axis value and should not be confused with the middle session position. Does a split-middle line prove that treatment worked?: No. It describes trend. Claims about an intervention’s effect also require appropriate design logic, replication, measurement quality, and consideration of alternative explanations. What is the easiest sequence to remember?: Remember “count, divide, mid-rate, mid-date, quarter, split.” Then check the problem’s stated conventions for odd numbers of points, missing data, or unusual axes.
Sources for Further Study
- BACB Test Content Outlines and Task Lists — current certification-study scope.
- Pass the Big ABA Exam: Split-Middle Line of Progress — BCBA glossary reference.
- Pearson sample chapter on single-subject designs — split-middle figure and visual-analysis context.
- Graphic Displays module — trend, variability, and line-of-progress terminology.
- BCBA Mock Exam: ABA level, trend, and variability — related internal study guide.
Take the Free BCBA Mock Exam
If you want a low-pressure way to check your recall, use the free practice resource below. Take the Free BCBA Mock Exam



