
A graph can suggest a reinforcement pattern, but the programmed contingency is what identifies the schedule. This ABA/BCBA study guide shows how to read axes, cumulative records, and FR/VR/FI/VI clues without guessing.
Table of Contents
- Reinforcement Schedules Graph: What the Axes Actually Show
- Match the Graph to the Schedule Rule
- Cumulative Records, Rate, and Why Slope Matters
- How to Read a Reinforcement Schedules Graph in Five Steps
- Common Graph Traps and a Short Practice Routine
- Turn Graph Reading Into Exam Practice
- Frequently Asked Questions
- Sources and Verification Notes
- Quick Review Checklist
- Take the Free BCBA Mock Exam
The phrase reinforcement schedules graph is broad. It might refer to a cumulative record, a classroom chart, a line graph of response rate, or a visual study aid. For this page, the scope is narrower: how to interpret common reinforcement-schedule graphs in an ABA or BCBA exam-preparation context.
The central rule is simple: use the graph to generate a hypothesis, then verify the contingency. A rising line does not automatically mean variable ratio, and a pause does not automatically mean fixed ratio. The schedule is defined by how a consequence is arranged after a response or across time. The visual pattern is supporting evidence.
This is an educational graph-reading guide, not an individualized treatment recommendation. Schedule selection and schedule thinning should be based on assessment, learner preferences and assent, safety, feasibility, data, and qualified professional judgment. Use the current BACB Test Content Outline and Handbook for current exam and certification boundaries.
Reinforcement Schedules Graph: What the Axes Actually Show
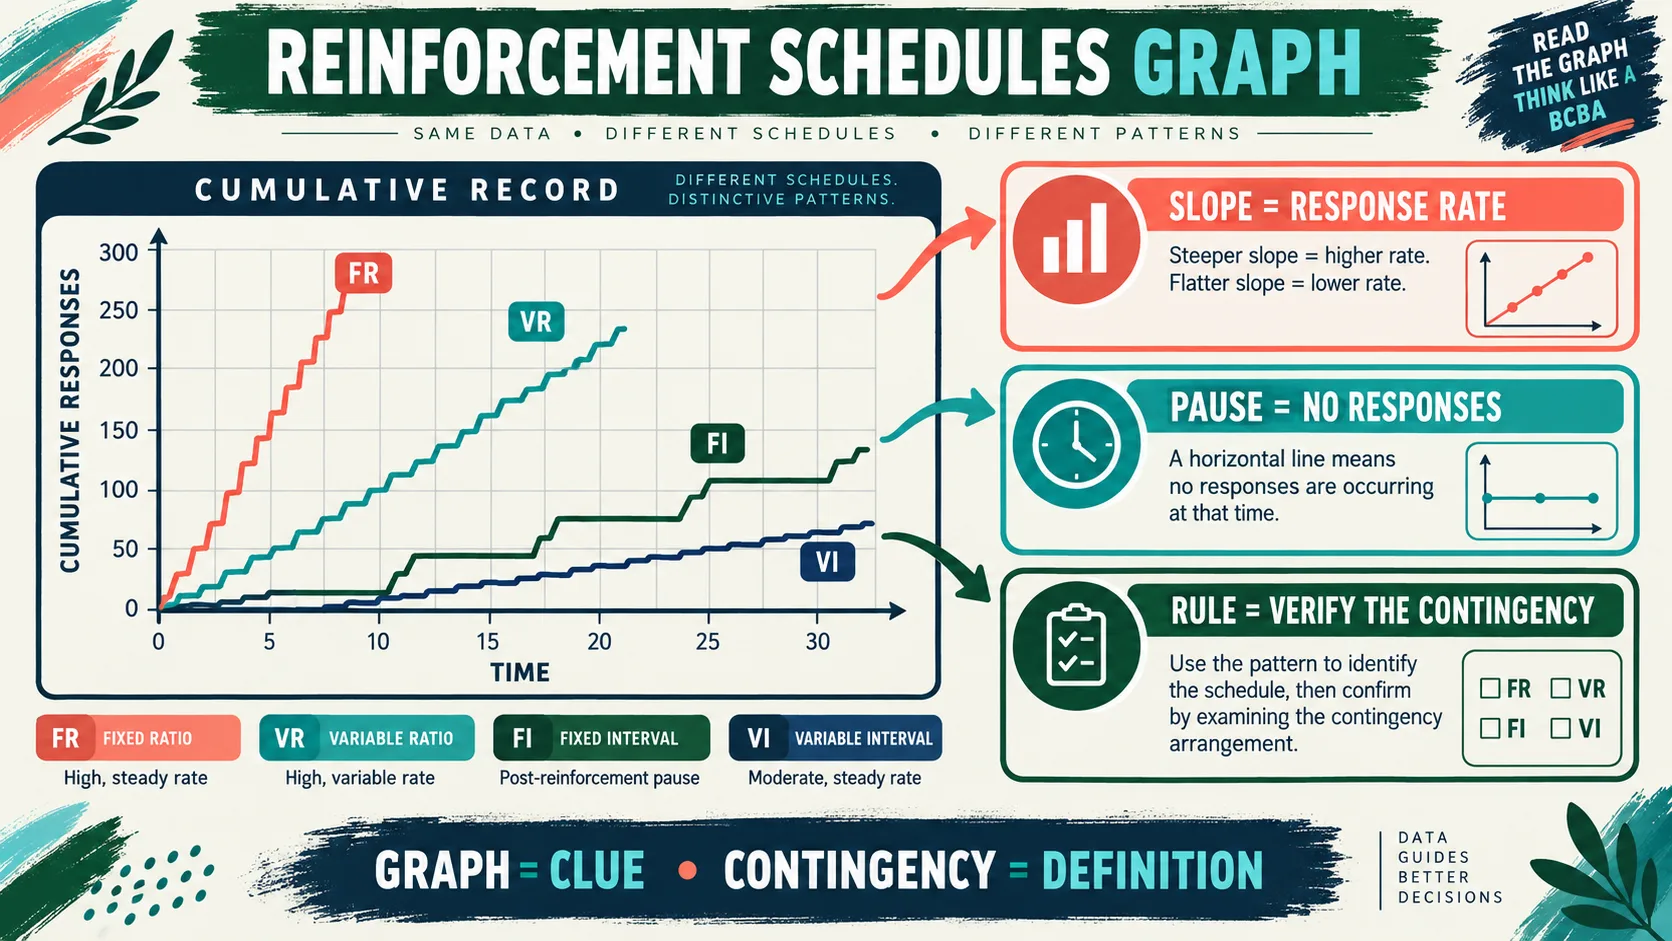
Start with the graph type. A cumulative record commonly places time on the horizontal axis and cumulative responses on the vertical axis. The slope represents response rate: a steeper line means more responses per unit of time, while a flatter line means a lower rate or a pause. The line generally does not move downward because cumulative responses do not disappear; a downward visual in another graph may represent a different metric.
A standard line graph may instead show responses per minute, percentage correct, or another summary for each session. In that case, the slope across data points is not the same thing as the within-session slope of a cumulative record. Read the axis labels before interpreting the pattern.
Next identify the consequence. Ask what is delivered, to which response, and under what response or time requirement. If the graph shows a high response rate but the prompt never states that a consequence depends on a response, do not force an FR, VR, FI, or VI label. It may be a rate graph of another procedure or an incomplete scenario.
Finally, look for the unit that varies. Ratio schedules depend on the number of responses. Interval schedules depend on time passing before a response can produce reinforcement. Fixed means the requirement is predictable or arranged at a constant value; variable means the requirement changes around a planned value or distribution. The graph can illustrate the result, but the rule determines the name.
Match the Graph to the Schedule Rule
Use this study matrix as a first pass. “Typical clue” does not mean “proof.” A real graph can be affected by the response, reinforcer, prior history, session length, competing contingencies, and the way data were summarized.
| Schedule | Rule | Common graph clue | Exam trap |
|---|---|---|---|
| FR Fixed ratio | Reinforcement follows a fixed number of responses. | A post-reinforcement pause followed by a relatively steady run may appear in a cumulative record. | Naming FR from a pause without checking that responses, not time, set the requirement. |
| VR Variable ratio | Reinforcement follows a changing number of responses around a planned value. | Often a high, steady response rate with less predictable pauses. | Assuming “unpredictable” means VR when the changing unit was actually time. |
| FI Fixed interval | The first response after a fixed time has passed is reinforced. | A pause or low rate early in the interval with accelerating responding near the end may appear. | Calling a curved pattern FI without confirming that time is the relevant requirement. |
| VI Variable interval | The first response after a changing time requirement has passed is reinforced. | Often a steadier, moderate response rate with less scalloping than FI. | Treating a steady line as proof of VI when the scenario never states an interval rule. |
| CRF Continuous | Each defined target response contacts the programmed consequence. | The response may acquire quickly, but the graph alone cannot show that every response was reinforced. | Calling any high-rate acquisition graph continuous without the contingency statement. |
Remember that a schedule describes a relation, not the value of the reinforcer. The same response requirement can be arranged with different consequences, and the learner’s behavior can change when the consequence loses value or when another contingency competes. Do not infer “preferred” or “effective” from a schedule label alone.
Cumulative Records, Rate, and Why Slope Matters
Cumulative records are useful because they display response accumulation over time. A constant slope suggests a relatively stable response rate during that segment. A change in slope means the response rate changed. A horizontal segment means no responses were recorded during that period. A bend or pause may be clinically or experimentally meaningful, but it needs a contingency and time context.
For an FR schedule, a pause after reinforcement can be followed by a run of responding. The amount of pausing can change with ratio size, reinforcer magnitude, response effort, and history. For an FI schedule, a pause early in the interval and accelerating responding near the end is a common textbook pattern, often called a scallop. These are patterns to recognize, not promises about every learner or every graph.
Do not confuse a cumulative record with a session-by-session graph. In a session graph, a point at 20 responses per minute might summarize the whole session. In a cumulative record, the local line angle shows the rate at that moment. Two graphs can contain the same total responses but tell different stories about when responding occurred.
Ask whether the scale is equal and whether the observation periods are comparable. A graph with a compressed time axis can make a line look steeper. A graph with different session lengths can make raw counts misleading. If the question asks for rate, identify the time unit; if it asks for cumulative responses, identify the total accumulation and the segment where the slope changes.
How to Read a Reinforcement Schedules Graph in Five Steps
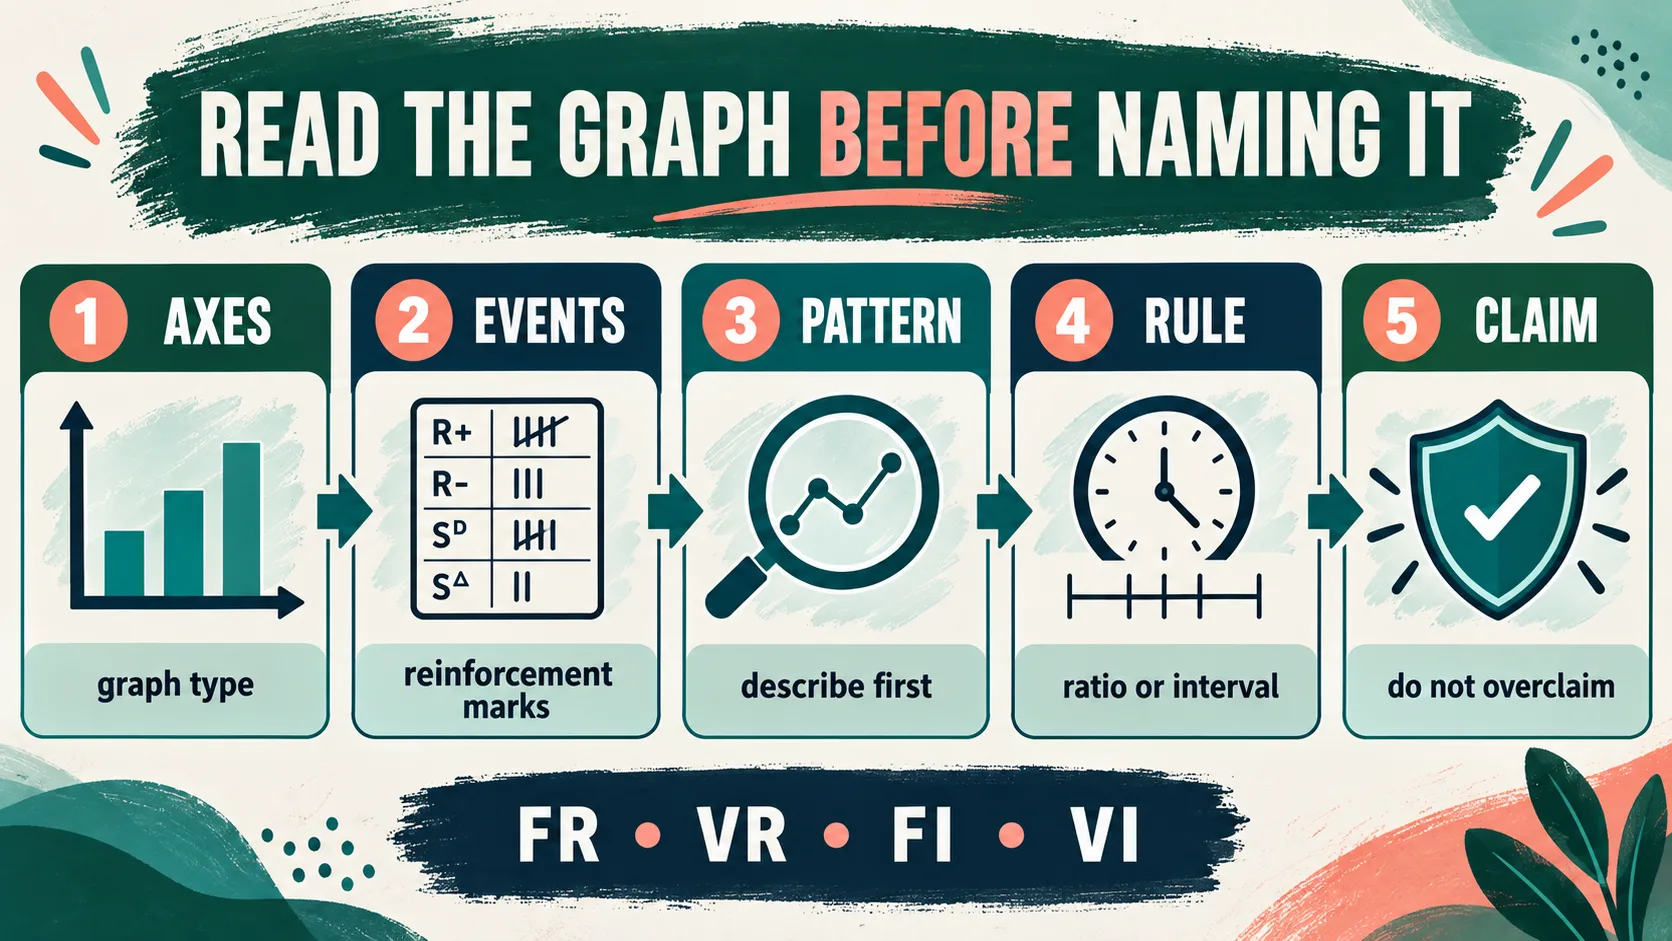
- Read the axes and graph type. Decide whether the y-axis is cumulative responses, rate, percentage, latency, or another measure. Do not interpret a pattern before knowing the measurement.
- Mark each reinforcement event if it is shown. Note whether the event follows a response count or becomes available after time. The schedule unit is often the decisive clue.
- Describe the local pattern. Use neutral language first: pause, steady slope, acceleration, variability, or change after a consequence. Avoid naming FR, VR, FI, or VI too soon.
- Check the programmed rule. Fixed or variable? Ratio or interval? If the scenario does not provide the rule, state what the graph can and cannot support.
- Interpret the data without overclaiming. Ask whether the graph supports a change in rate, a schedule classification, or a functional relation. A graph can show change without proving its cause.
Here is a compact example. A learner responds rapidly, but reinforcement follows the first response after a variable amount of time. The correct classification is a variable-interval arrangement even if the response rate looks steady. The visual pattern is consistent with a VI clue, but the time-based rule is what determines the label.
Now change the example: reinforcement follows every fifth correct response. A post-reinforcement pause and run may be visible, but the schedule is fixed ratio because the response count is fixed. If the graph shows a pause but the stem says the first response after 30 seconds is reinforced, time—not the pause—controls the classification.
Common Graph Traps and a Short Practice Routine
- Pattern equals schedule. A scallop is a clue associated with some FI arrangements, not a definition.
- Variable equals ratio. “Variable” says the requirement changes; it does not say whether responses or time are counted.
- High rate equals VR. Response rate is an outcome. Verify the response requirement and consequence rule.
- Flat line equals extinction. A flat segment can reflect no responding, a measurement problem, a pause, or another condition. Identify the programmed consequence before naming extinction.
- Graph equals function. A graph may show behavior change, but functional analysis requires an appropriate experimental comparison.
For a ten-minute drill, draw four small cumulative records. Label the axes but leave the schedule names blank. Under each graph, write one neutral pattern description, one possible schedule hypothesis, and the exact contingency fact you would need to confirm it. This trains the discrimination that exam questions often require.
Turn Graph Reading Into Exam Practice
Use the Free BCBA Mock Exam for timed graph and schedule practice. When you miss an item, record four facts: graph type, measurement, requirement unit, and consequence. Then explain why the distractors were tempting but unsupported. That review is more useful than memorizing “VR is steady” as an absolute rule.
For clinical or educational work, do not change a learner’s reinforcement schedule based on a graph-reading shortcut. Bring the data, the contingency description, and the relevant context to the responsible supervisor or qualified professional. A study guide can help you interpret a question; it cannot replace assessment, consent, safety planning, or individualized decision-making.
Frequently Asked Questions
What does a reinforcement schedules graph show?: It shows behavior or response patterns under an arrangement in which a consequence is delivered according to a response or time requirement. The exact graph may be a cumulative record, rate graph, or another display. Read the axes before interpreting the pattern.
How can I tell FR from FI on a graph?: Do not rely on shape alone. FR is controlled by a fixed number of responses; FI is controlled by a fixed amount of time before a response can produce reinforcement. Use the contingency statement as the deciding evidence, then use the graph as a supporting clue.
Does a steady graph prove variable interval?: No. A steady response rate may be consistent with VI, but it can arise under other conditions. Verify that the first response after a changing time requirement is the event that produces reinforcement.
Is a cumulative record the same as a line graph?: Both use lines, but a cumulative record plots cumulative responses over time, so its slope represents response rate. A session-by-session line graph may plot a summary such as responses per minute. The axes and measurement rule decide how the line should be read.
Sources and Verification Notes
For current exam boundaries, use the BACB Test Content Outline and BCBA Handbook. For applied context, review the peer-reviewed discussion of schedule thinning after functional communication training. This page is a graph-reading study aid, not an official BACB graph key or a clinical schedule prescription.
Bottom line: Read the axes, describe the pattern, identify whether the requirement is response-based or time-based, verify fixed versus variable, and then name the schedule. The contingency is the definition; the graph is evidence that helps you reason.
Quick Review Checklist
Use this final checklist to turn reinforcement schedules graph into exam-ready reasoning. The goal is not to memorize a label in isolation; it is to identify the relevant evidence and explain why the best answer fits the scenario. Key ideas to review:
- State the central definition or decision point for reinforcement schedules graph in your own words.
- Identify the detail that makes reinforcement schedules graph different from its closest related ABA term.
- Separate the observable facts in a scenario from assumptions that are not supported by the facts.
- Write one example and one nonexample so you can recognize the concept in a new setting.
Exam application checks:
- Ask what the question is actually requesting before comparing the answer choices.
- Mark the antecedent, response, consequence, or other evidence that supports the selected answer.
- Look for a distractor that describes a related process but does not answer the specific question.
Final self-check:
- Explain how you would verify the interpretation with clear observations or data.
- Change one detail in the scenario and decide whether your answer should change.
- Give a one-sentence rationale that a supervisor or study partner could evaluate.
Take the Free BCBA Mock Exam
When you are ready to apply the idea, use the free practice resource below for additional feedback. Take the Free BCBA Mock Exam