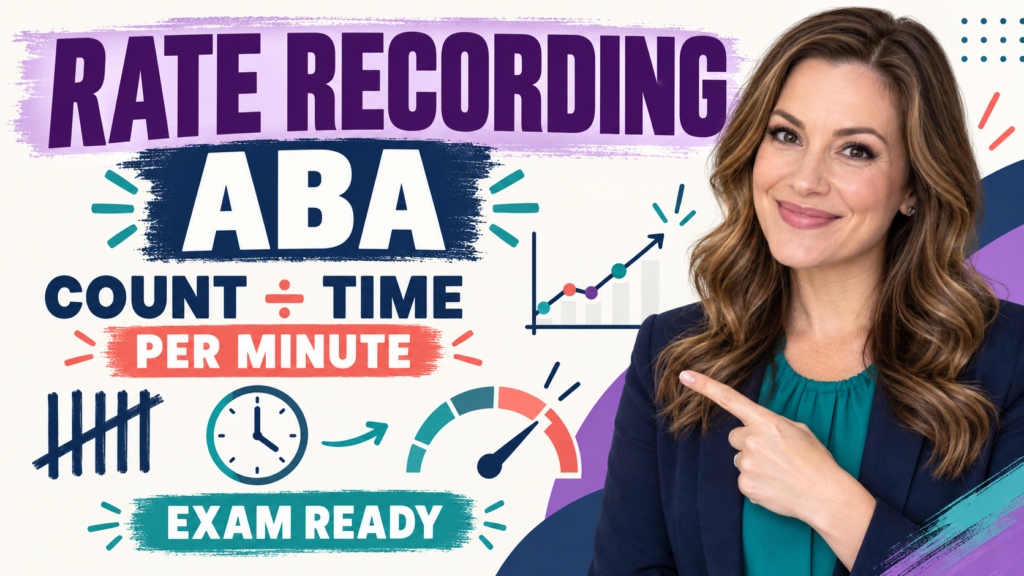
Rate recording ABA turns a response count into a time-normalized measure: rate equals count divided by the amount of time observed. It is useful when observation periods differ or when the speed of responding matters.
Table of Contents
- What Is Rate Recording in ABA?
- How Do You Calculate Rate Recording ABA?
- How Is Rate Different From Frequency Recording?
- Which Time Unit Should You Use?
- How Does Rate Recording Affect a Graph?
- What Common Problems Distort Rate?
- What Does the BCBA Exam Test?
- What Is the Bottom Line?
- Quick Review Checklist
- Take the Free BCBA Mock Exam
Rate recording ABA answers a different question from a simple frequency count. Frequency tells you how many responses occurred. Rate tells you how many responses occurred per unit of time. If one learner emits 12 responses in 60 seconds and another emits 12 responses in 10 minutes, the counts match but the rates do not.
The denominator must be defined before comparing data. “Per minute” is common, but a team might use per hour, per session, or another standardized unit depending on the behavior and decision. The BCBA Test Content Outline treats rate as a temporal dimension of measurement; consistent units make the graph interpretable.
What Is Rate Recording in ABA?
Rate is the number of responses divided by the total time observed: Rate = frequency ÷ time Suppose a learner emits 18 vocal requests during a six-minute observation. The rate is 18 ÷ 6 = 3 requests per minute. If another observation contains 18 requests in nine minutes, its rate is 2 requests per minute. Rate recording makes the unequal observation times visible instead of treating both counts as equivalent.
Rate should be used only when the response can be counted meaningfully and the observation time is known. If the response definition changes, the numerator is no longer comparable. If the observer forgets when observation started or stopped, the denominator is unreliable even when the count looks precise.
How Do You Calculate Rate Recording ABA?
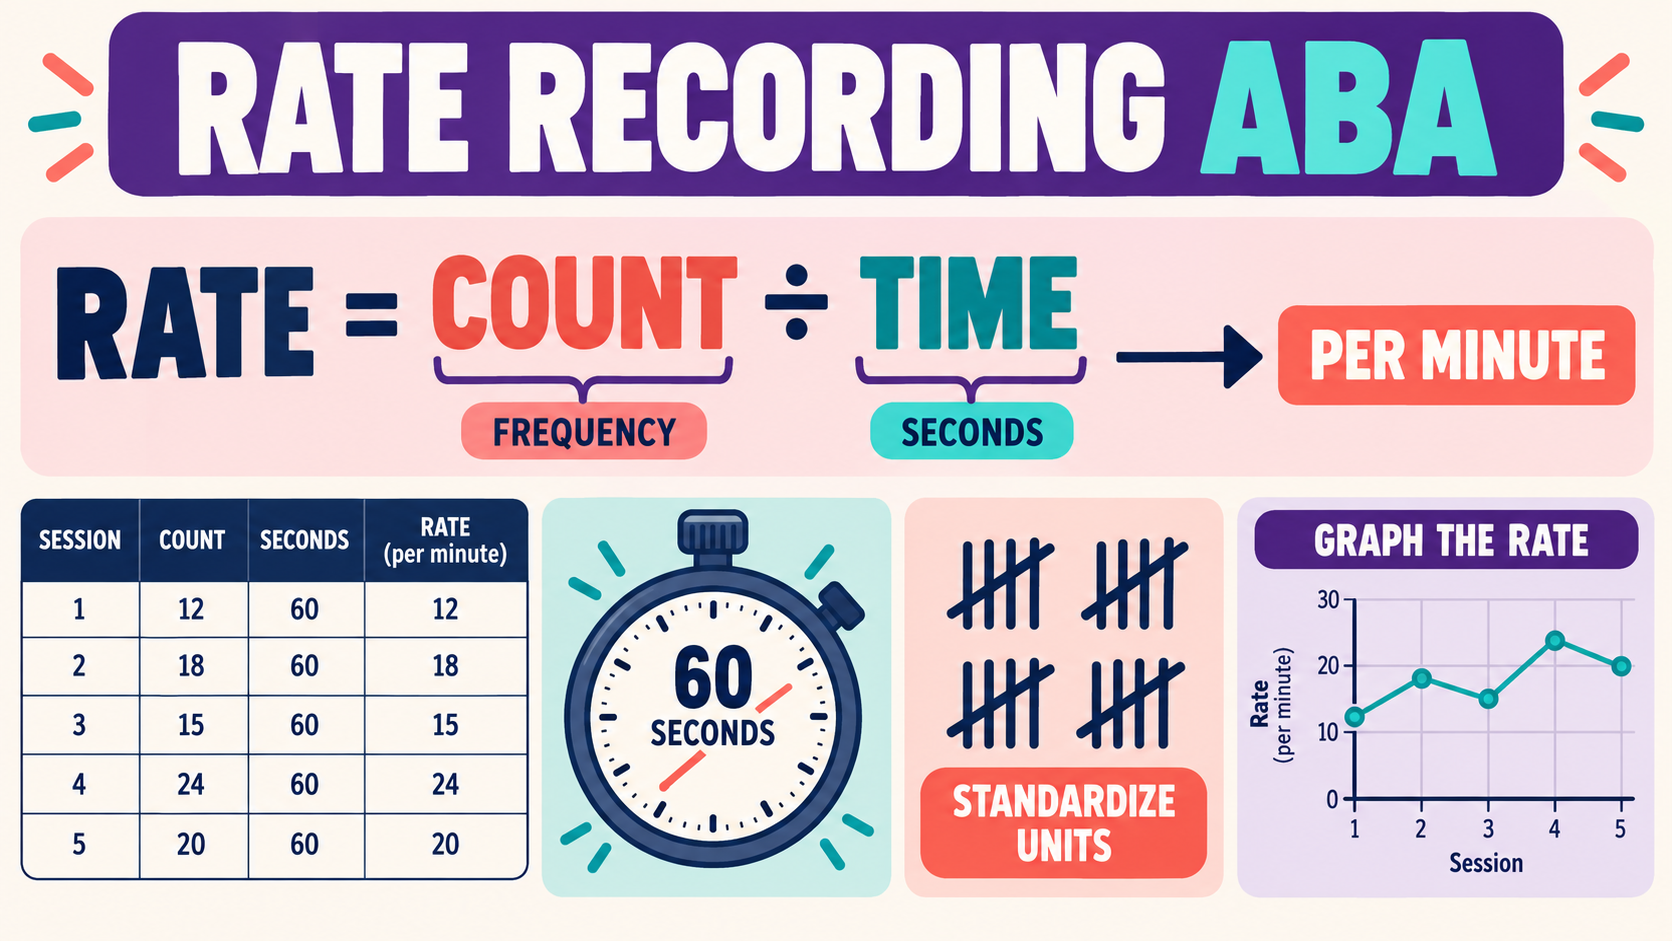
Use a consistent sequence:
- Write the operational definition of the response.
- Count the responses that meet that definition.
- Record the exact observation time.
- Convert the time to the chosen unit.
- Divide the count by the time and label the result with its unit.
| Observation | Frequency | Time observed | Rate |
|---|---|---|---|
| A | 12 responses | 60 seconds = 1 minute | 12 per minute |
| B | 18 responses | 6 minutes | 3 per minute |
| C | 10 responses | 30 seconds = 0.5 minute | 20 per minute |
Observation C has the lowest count but the highest rate because the responses occurred in a short period. This is why a report should never write “10 responses” when the clinical decision depends on how quickly they occurred. Label the unit every time: responses per minute, requests per hour, or another agreed unit.
How Is Rate Different From Frequency Recording?
Frequency recording is a count. Rate is a count normalized by time. A broad frequency measure may be appropriate when every observation lasts the same amount of time and the count itself answers the question. Rate is more informative when observation durations vary, when sessions are interrupted, or when acceleration and deceleration matter.
This distinction does not mean rate is always better. A very short observation can produce an unstable rate: one extra response in 30 seconds changes the result more than one extra response in a 60-minute observation. When the number is used for an important decision, consider the observation length, the response definition, and whether several observations show the same pattern. The site’s frequency recording guide covers the broader count-based measure. This page adds the denominator logic: the rate page should be the one you use when the time unit is part of the question.
Which Time Unit Should You Use?
Choose a unit that makes the result readable and supports the decision. Responses per minute are often practical for classroom or therapy observations. Responses per hour may be easier for a behavior observed across a long day. If a response is rare, per hour may avoid tiny decimals. If it is very frequent, per minute may avoid unwieldy numbers.
Do not compare 2 responses per minute with 2 responses per hour as if they were equal. Convert both to the same unit first. For example, 2 responses per minute equals 120 responses per hour. Keep the conversion rule visible in a data note or graph label so another reader can reproduce the calculation.
How Does Rate Recording Affect a Graph?
Place the observation sequence or date on the horizontal axis and the rate on the vertical axis. Label the unit in the y-axis title. If the observation time changes, note it in the data record and verify that the rate, not the raw count, is what has been graphed. A graph with unlabeled units can make a correct calculation look ambiguous.
Rate is not the same as a percentage. Percentage uses a count divided by the number of opportunities, multiplied by 100. Rate uses time as the denominator. If opportunities differ because the learner had different chances to respond, percentage may answer a different question. If time differs and the response can occur freely, rate may be more appropriate. The denominator follows the measurement goal.
What Common Problems Distort Rate?
- Unclear start and stop: a count without exact observation time cannot produce a defensible rate.
- Mixed units: comparing per-minute and per-hour values without conversion creates a false trend.
- Changed definitions: adding or removing response forms changes the numerator.
- Very short windows: one missed or extra response may create a large difference.
- Confusing opportunities with time: an opportunity-based percentage is not a rate.
- Overinterpreting a spike: a high rate shows responding increased in that observation; it does not identify a function by itself.
Observer training should include the response definition, timer rule, unit conversion, and a worked example. When appropriate, calculate agreement on the count and check whether observers used the same start and stop times. If the team uses software, audit the formula rather than assuming the displayed number is correct.
When a session contains several activities, record the activity boundaries instead of pooling everything automatically. A work period and a break period may have different opportunities, response patterns, and observation lengths. A single session rate can hide that contrast. If the clinical question is about a specific component, calculate the rate for that component and name the segment in the data record. If the question is about the entire session, use the total count divided by the total observed time rather than averaging the component rates without considering their durations.
What Does the BCBA Exam Test?
- Know the formula: rate equals frequency divided by time.
- Read the denominator: longer and shorter observations cannot be compared by count alone.
- Keep units consistent: convert minutes and seconds before comparing values.
- Separate rate from percentage: time and opportunities are different denominators.
- Consider stability: a short observation can make a single response look disproportionately important.
- Interpret carefully: rate describes temporal occurrence; it does not by itself establish cause or function.
What Is the Bottom Line?
Rate recording ABA is a count with a time denominator. Define the response, record exact observation time, standardize the unit, show the formula, and label the graph. Use frequency when a raw count is sufficient, use rate when time normalization matters, and do not confuse either one with opportunity-based percentage. For more practice with BCBA measurement and graph questions, try the free BCBA mock exam.
For targeted review, use our rate recording ABA practice questions to apply the concept in exam-style scenarios.
Quick Review Checklist
Use this final checklist to turn rate recording ABA into exam-ready reasoning. The goal is not to memorize a label in isolation; it is to identify the relevant evidence and explain why the best answer fits the scenario. Key ideas to review:
- State the central definition or decision point for rate recording ABA in your own words.
- Identify the detail that makes rate recording ABA different from its closest related ABA term.
- Separate the observable facts in a scenario from assumptions that are not supported by the facts.
- Write one example and one nonexample so you can recognize the concept in a new setting.
Exam application checks:
- Ask what the question is actually requesting before comparing the answer choices.
- Mark the antecedent, response, consequence, or other evidence that supports the selected answer.
- Look for a distractor that describes a related process but does not answer the specific question.
Final self-check:
- Explain how you would verify the interpretation with clear observations or data.
- Change one detail in the scenario and decide whether your answer should change.
- Give a one-sentence rationale that a supervisor or study partner could evaluate.
Take the Free BCBA Mock Exam
When you are ready to apply the idea, use the free practice resource below for additional feedback. Take the Free BCBA Mock Exam