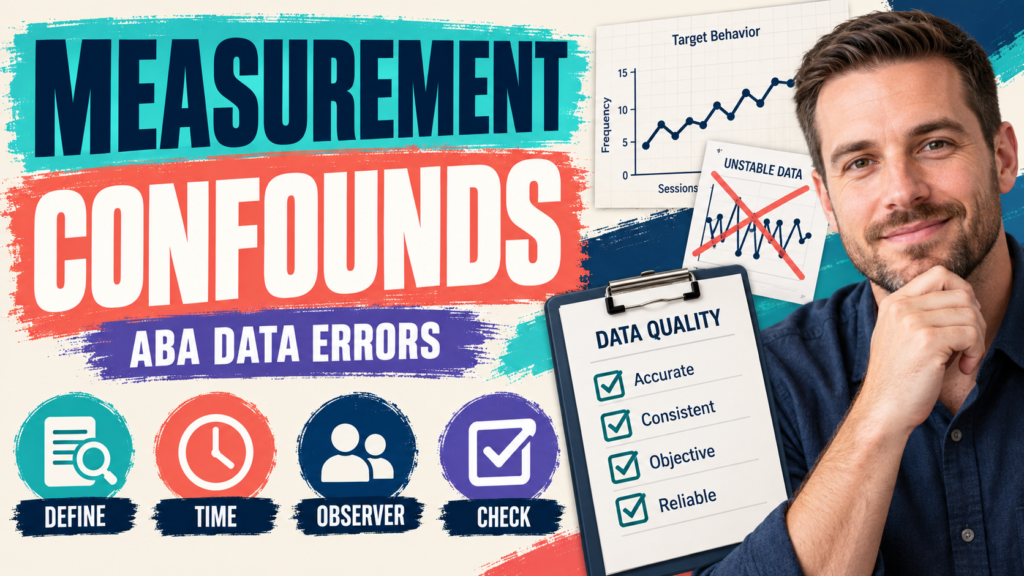
Measurement confounds ABA data when the way a behavior is observed, defined, or calculated changes the result in a way that can be mistaken for a learner or intervention effect. Measurement confounds ABA are hidden influences that make a graph difficult to interpret. An observer may gradually change what counts as a response. A session may become longer while the team continues to compare raw counts. A new staff member may collect data differently from the person who collected baseline. The behavior may not have changed, but the measurement system has.
Table of Contents
- What Is a Measurement Confound in ABA?
- What Are the Main Measurement Confounds ABA Learners Should Know?
- How Does Definition Drift Affect the Graph?
- Why Do Denominators and Time Units Matter?
- How Do Observer Drift and Reactivity Appear?
- How Can You Reduce Measurement Confounds?
- What Does the BCBA Exam Test?
- What Is the Bottom Line?
- Quick Review Checklist
- Take the Free BCBA Mock Exam
The BCBA Test Content Outline connects measurement with data-based decisions. Before accepting a trend, ask whether the behavior definition, observation time, observer, materials, and calculation rules stayed stable enough for the comparison to be meaningful.
What Is a Measurement Confound in ABA?
A measurement confound occurs when a feature of the measurement process systematically changes the data and can be confused with the variable of interest. It is not simply random error. Random error may add noise; a confound can create a directional pattern that looks like improvement, deterioration, or a treatment effect.
For example, if staff begin prompting the learner more often and still record prompted responses as independent, the percentage may rise without a true increase in independence. If observers stop recording brief responses, frequency may fall even though the behavior is unchanged. The graph cannot correct a measurement rule that was never made explicit.
What Are the Main Measurement Confounds ABA Learners Should Know?
| Confound | How it changes data | First safeguard |
|---|---|---|
| Definition drift | Different responses are counted over time | Operational definition and examples |
| Denominator change | Percentages change because opportunities change | Keep opportunities and units visible |
| Observer drift | Scoring gradually shifts | Retraining and agreement checks |
| Reactivity | Behavior changes because observation is occurring | Use unobtrusive, consistent procedures |
How Does Definition Drift Affect the Graph?
Definition drift happens when the team gradually changes the boundary of a response. “Aggression” may begin as hitting and later include threats or loud vocalizations. The rate can appear to increase because the category expanded. The opposite can happen when observers become stricter and stop counting borderline responses.
Use a definition that describes observable features and clear boundaries. Include examples and nonexamples, train observers with sample situations, and revisit the definition when the program changes. If the target changes, mark the change on the graph instead of presenting the entire series as one uninterrupted measure.
Write the rule so two trained observers can make the same decision without asking what the author intended. That small test often reveals vague words such as “disruptive,” “appropriate,” or “cooperative.” Replace them with observable actions, a clear start point, and a clear stop point.
Why Do Denominators and Time Units Matter?
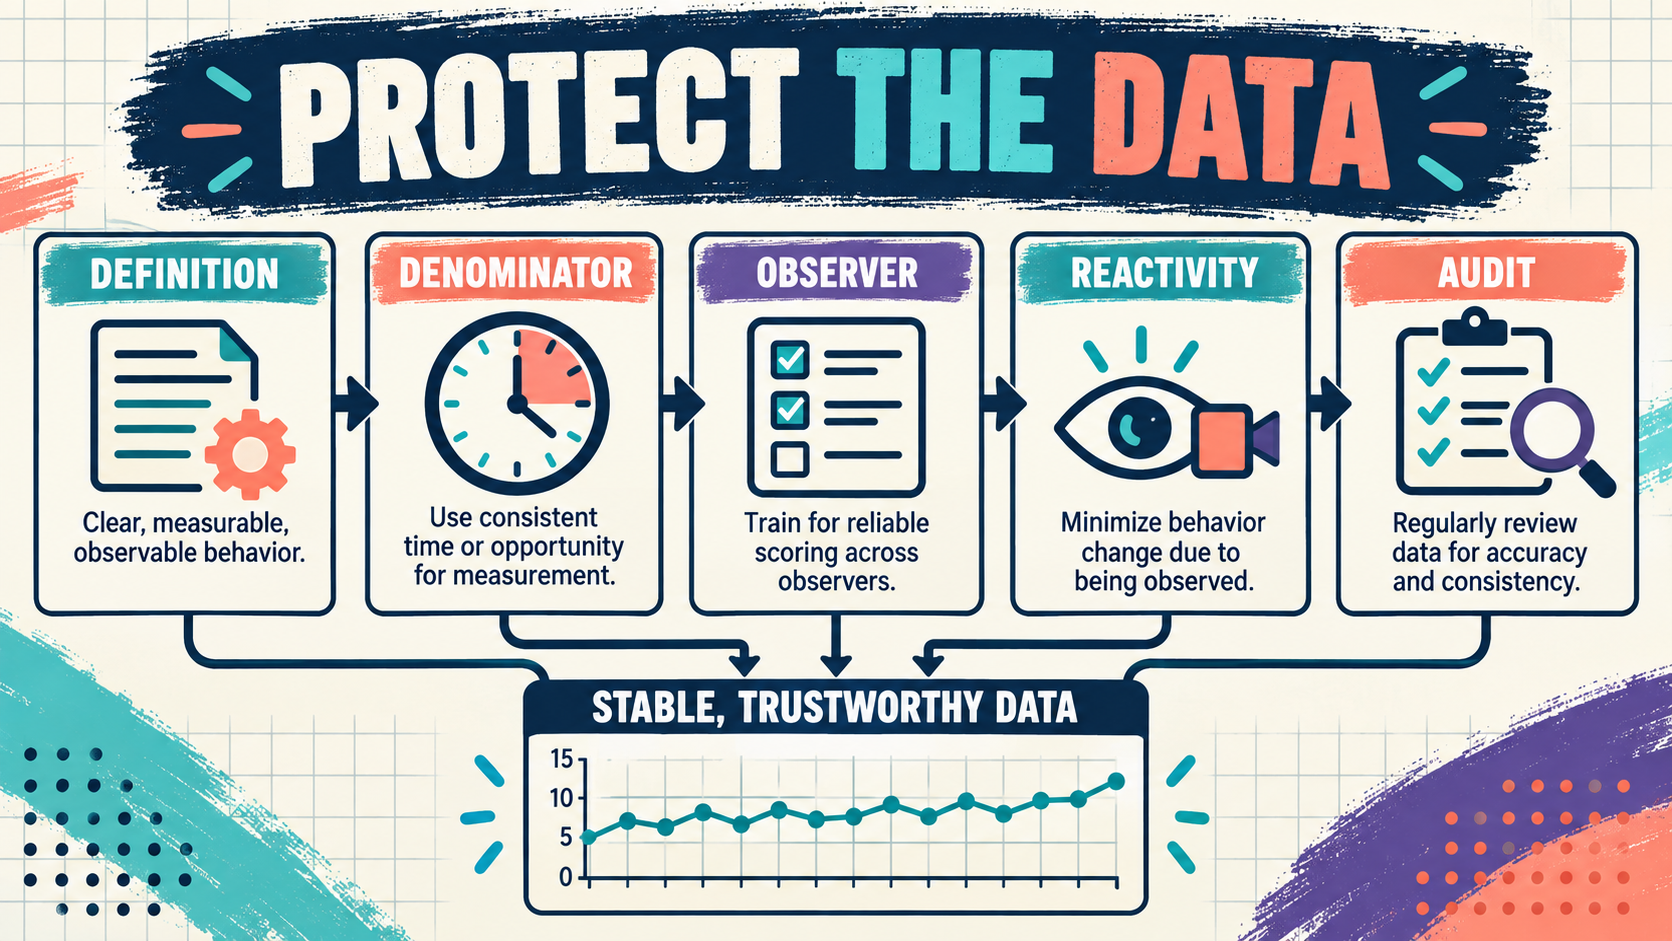
Frequency is a count; rate is a count divided by time; percentage is a count divided by opportunities. A longer session can produce more responses even if the rate is stable. A learner can receive a higher percentage because the team offered easier opportunities. Always name the denominator and standardize the unit before comparing points.
Short segments can magnify one missed response. If a team compares a two-minute baseline with a ten-minute intervention using raw counts, the graph may misrepresent change. Use a rate or another dimension that matches the question, and record the actual observation duration.
How Do Observer Drift and Reactivity Appear?
Observer drift is a gradual shift in scoring. It can appear as a smooth improvement or decline that does not match any intervention change. Reactivity occurs when the learner or staff respond differently because they know observation is happening. New observers, cameras, unfamiliar settings, or a highly visible data sheet can all alter behavior or implementation.
Plan occasional agreement checks, rotate observers when practical, and compare data across similar conditions. Agreement is not a substitute for a good definition, but low agreement is a signal that the measurement system needs attention before the graph is used for a major decision.
Also separate a measurement confound from a real change in the behavior. A lower rate after an intervention may be meaningful, but only if the observation period, response opportunities, materials, and scoring rules stayed comparable. Write a short data note whenever one of those features changes. A reader can then decide whether to analyze the points together, treat them as separate phases, or collect a small reliability sample before making a programming decision.
How Can You Reduce Measurement Confounds?
- Define before collecting: write the response, boundary, examples, and nonexamples.
- Standardize opportunities: record time, trials, prompts, and materials that shape the denominator.
- Check implementation: review whether staff delivered the intervention and scoring rule as planned.
- Audit the graph: mark observer, setting, procedure, and definition changes before explaining a trend.
What Does the BCBA Exam Test?
- Changing observers can change scores: inspect drift before claiming a learner change.
- Count is not rate: rate includes a time denominator.
- Percentage has opportunities: a new number of trials changes the denominator.
- Prompting can confound independence: label prompted and independent responses separately.
- Reactivity is not treatment: behavior can change because observation changed the context.
- Document changes: a graph should show when definitions, materials, or procedures changed.
What Is the Bottom Line?
Measurement confounds ABA data when the measurement system changes in a way that looks like a behavior or intervention effect. Protect the definition, denominator, timing, observer, and implementation record before interpreting the line. For more practice with measurement and graph questions, try the free BCBA mock exam. It is study support, not a replacement for supervision or data review.
For targeted review, use our measurement confounds ABA practice questions to apply the concept in exam-style scenarios.
Quick Review Checklist
Use this final checklist to turn measurement confounds ABA into exam-ready reasoning. The goal is not to memorize a label in isolation; it is to identify the relevant evidence and explain why the best answer fits the scenario. Key ideas to review:
- State the central definition or decision point for measurement confounds ABA in your own words.
- Identify the detail that makes measurement confounds ABA different from its closest related ABA term.
- Separate the observable facts in a scenario from assumptions that are not supported by the facts.
- Write one example and one nonexample so you can recognize the concept in a new setting.
Exam application checks:
- Ask what the question is actually requesting before comparing the answer choices.
- Mark the antecedent, response, consequence, or other evidence that supports the selected answer.
- Look for a distractor that describes a related process but does not answer the specific question.
Final self-check:
- Explain how you would verify the interpretation with clear observations or data.
- Change one detail in the scenario and decide whether your answer should change.
- Give a one-sentence rationale that a supervisor or study partner could evaluate.
Take the Free BCBA Mock Exam
When you are ready to apply the idea, use the free practice resource below for additional feedback. Take the Free BCBA Mock Exam