
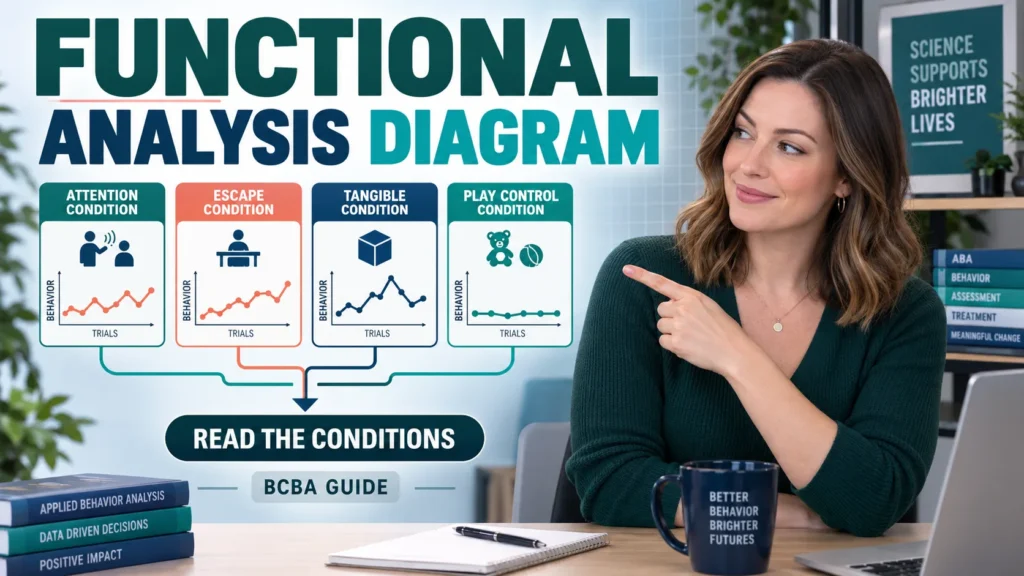
Short answer: A functional analysis diagram is a visual map of an assessment: it shows the target behavior, the test and control conditions, what consequence is arranged in each condition, the data pattern, and the hypothesis that the comparison supports. For BCBA exam questions, read the diagram as a controlled comparison—not as a decorative flowchart and not as proof that one isolated behavior has one permanent cause.
Table of Contents
- What does a functional analysis diagram show?
- What are the core parts of an FA diagram?
- How do the standard conditions fit together?
- How should you read a functional analysis graph?
- How is an FA diagram different from other assessment tools?
- How should you solve a BCBA exam question?
- What does the diagram not prove?
- What are the common mistakes?
- Functional analysis diagram FAQ
- Take the Free BCBA Mock Exam
The most important question is, “What changed across conditions, and what happened to the behavior?” A functional analysis (FA) may be represented as a graph, a table, a flow diagram, or a combination of all three. The format can change, but the logic remains: arrange relevant conditions, measure the operationally defined response, compare responding with a control or comparison condition, and interpret the pattern within the limits of the assessment. Table of Contents
What does a functional analysis diagram show?
An FA diagram shows the relationship among four elements: the behavior being measured, the condition arranged by the analyst, the consequence delivered after the behavior, and the resulting data pattern. A good diagram makes the comparison visible. It does not merely list a client’s history or repeat the phrase “the behavior is maintained by attention.” It shows how the hypothesis was tested.
Imagine a diagram with four branches: attention, escape, tangible, and a play or control condition. Each branch represents a different test arrangement. In an attention condition, the analyst may provide brief attention following the target response. In an escape condition, a task may be presented and a break may follow the response. In a tangible condition, access to a preferred item may follow the response. The control condition is arranged to reduce the establishing operations and provide preferred interaction or materials freely. The exact arrangement depends on the case, risk, and assessment plan; these examples describe the logic rather than a universal clinical script.
The diagram becomes meaningful when the response is measured across repeated sessions or trials. If responding is consistently higher in one test condition than in the control condition, the pattern may support a functional hypothesis under the tested conditions. If all conditions are similar, the results may be undifferentiated. If more than one test condition is elevated, the behavior may be sensitive to multiple consequences or the assessment may need a more precise interpretation.
What are the core parts of an FA diagram?
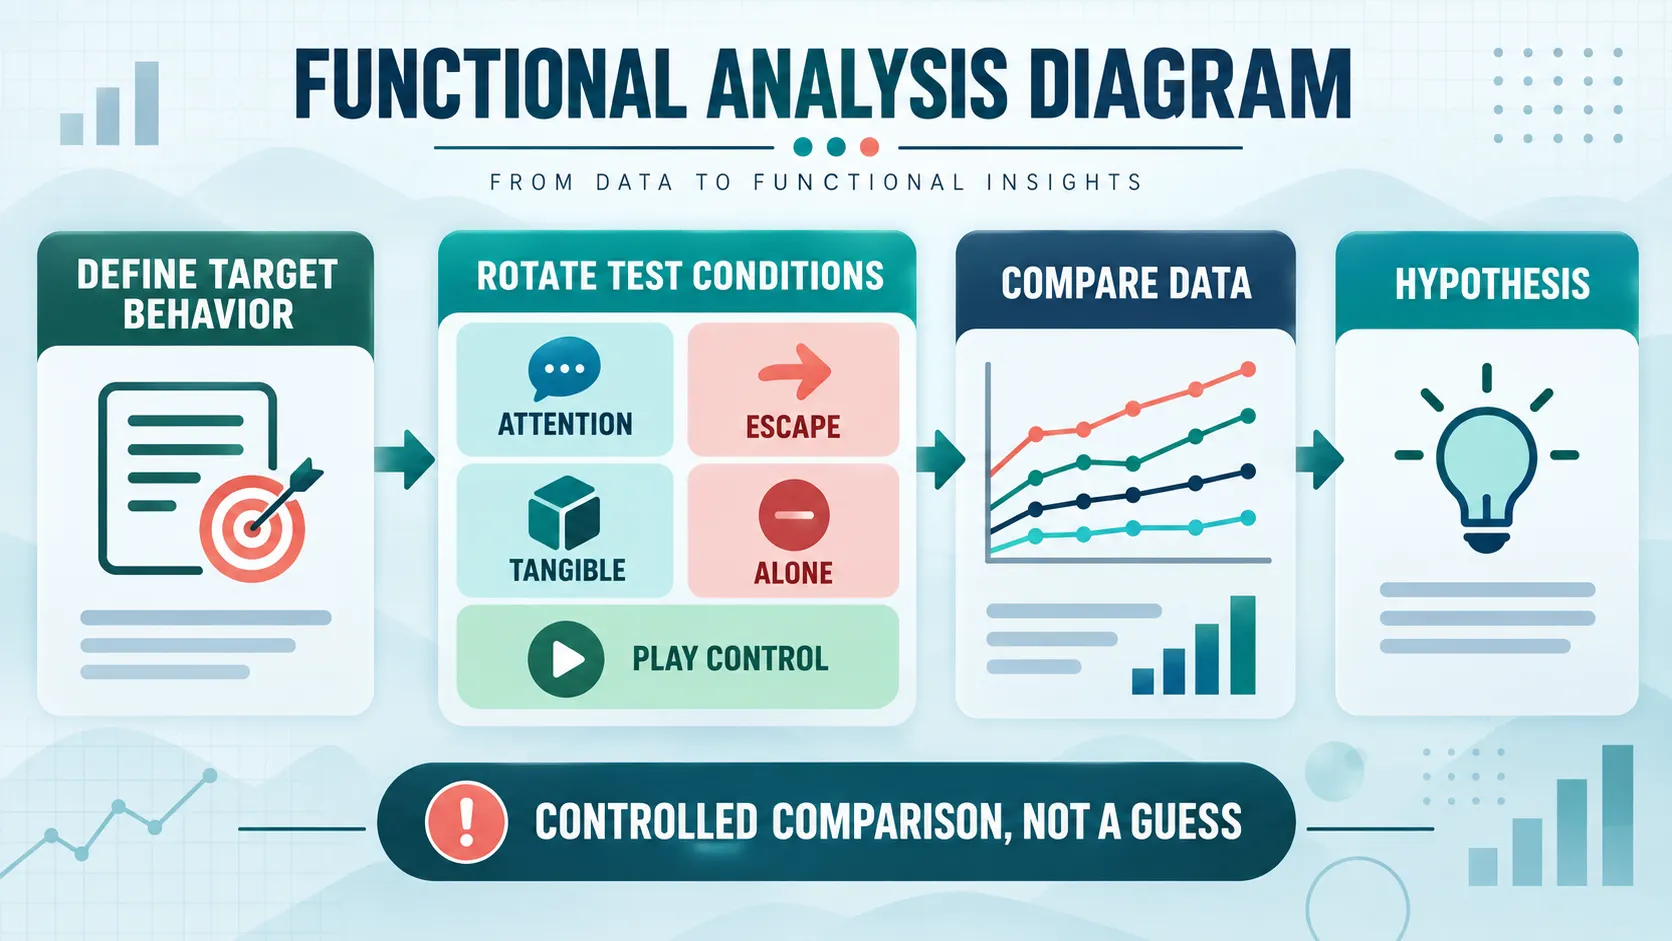
Most functional analysis diagrams can be decoded by locating five parts. The labels may be different, but the reader should be able to identify each one:
- Target behavior: the operationally defined response, such as aggression, self-injury, disruption, or another behavior selected for assessment. “Noncompliance” without a measurable definition is not enough to interpret a graph.
- Test conditions: the arranged contexts in which a suspected reinforcer is made contingent on the response. A condition is not just a setting; it is a programmed relation among events.
- Control or comparison condition: the reference condition used to judge whether responding is elevated when the suspected contingency is present. The label may be play, control, enriched, or another source-defined term.
- Data display: a graph, rate, frequency, percentage, latency, or another measure that allows the conditions to be compared. The y-axis and phase or session labels matter.
- Interpretive statement: a cautious hypothesis that connects a differentiated pattern to the suspected function. The statement should match the data and the conditions actually tested.
Look for the arrow in the logic: arrange condition → observe response → deliver programmed consequence → compare data. A diagram that jumps from a caregiver report directly to a function skips the experimental comparison. A diagram that includes a consequence but never shows a control or repeated comparison may be describing an intervention or a descriptive observation rather than a complete FA logic.
Also check whether the diagram distinguishes the antecedent arrangement from the consequence contingency. For example, demand presentation is not itself proof of an escape function. The interpretation depends on what happens after the response and whether responding is higher in the demand-related test condition than in the comparison condition.
How do the standard conditions fit together?
Classic functional-analysis teaching materials often use test conditions for attention, escape, tangible, and alone, together with a play or control condition. Modern assessments can use modified, trial-based, brief, synthesized, or otherwise individualized formats. A diagram should therefore be read by the condition labels and contingencies, not by memorizing that every FA must contain the same five boxes.
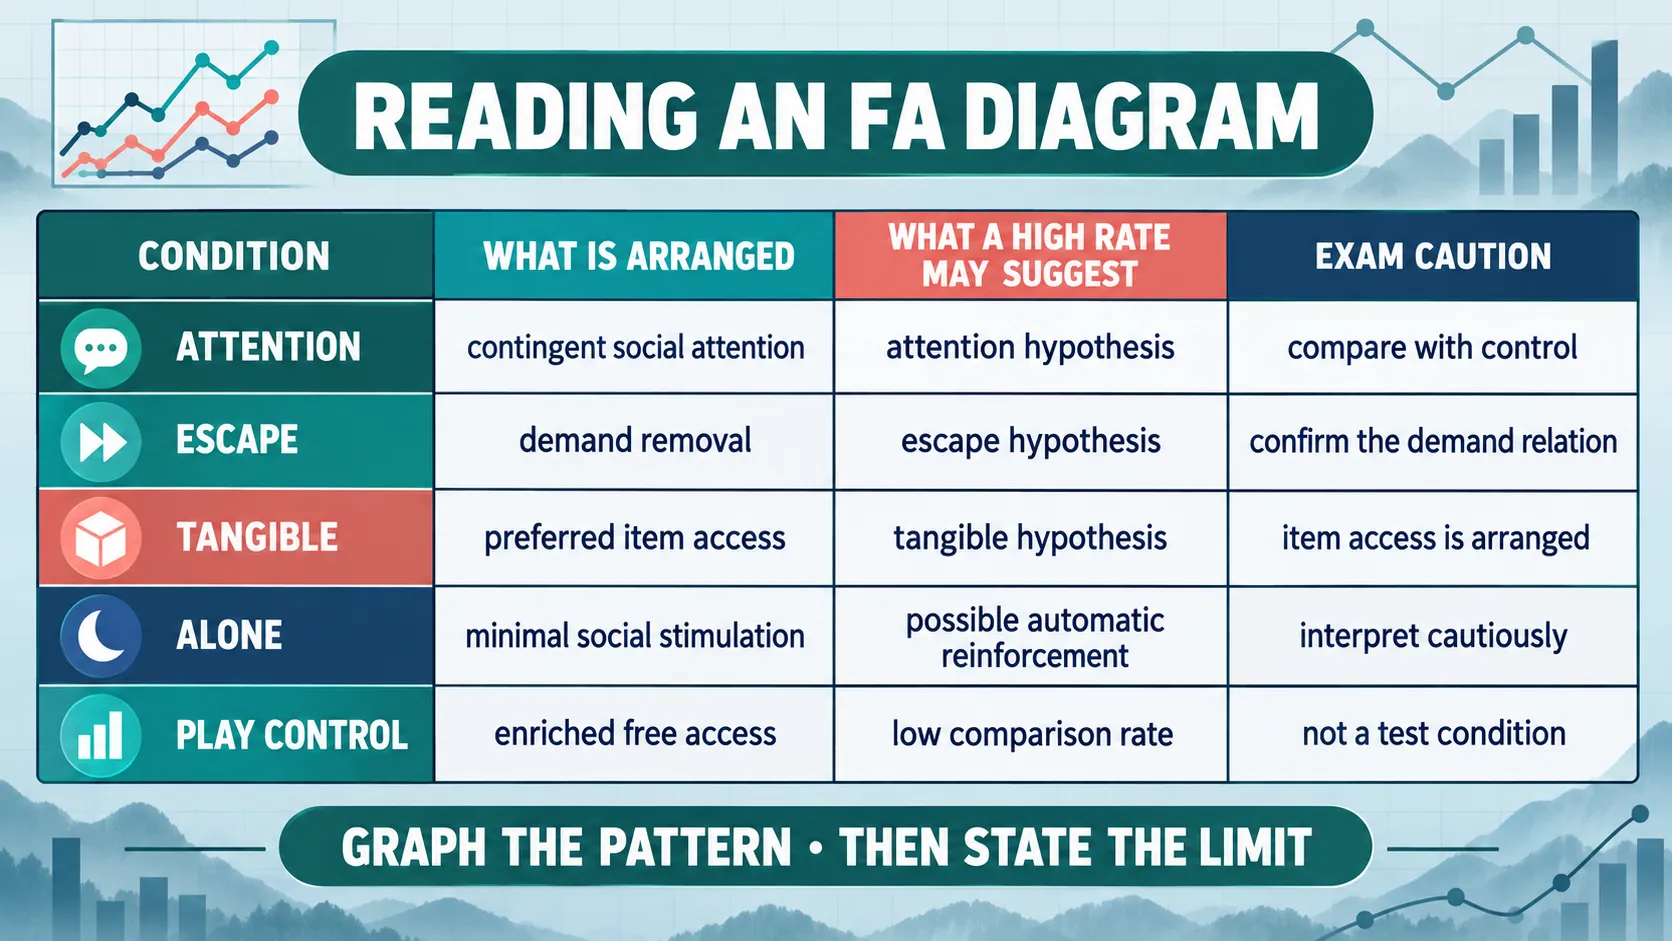
| Condition | What is arranged? | What a higher pattern may suggest | Exam caution |
|---|---|---|---|
| Attention | Attention follows the target response according to the test arrangement. | Social-positive reinforcement may be relevant under the tested condition. | Do not infer attention from a caregiver report alone; read the comparison. |
| Escape | Instructional or task demands are presented and a break or task removal follows the response. | Negative reinforcement through escape may be relevant under the tested condition. | The demand is an antecedent; escape is the consequence being tested. |
| Tangible | Access to a preferred item or activity follows the target response. | Socially mediated access to the item may be relevant. | A preferred item being present does not automatically make the function tangible. |
| Alone | Social interaction and programmed materials are minimized according to the assessment design. | A pattern can be consistent with automatic reinforcement when it differs from the comparison. | Safety and feasibility are central; do not treat this condition as interchangeable with every no-attention arrangement. |
| Play or control | Preferred interaction and materials may be freely available while relevant establishing operations are reduced. | A lower response level supplies a comparison for test-condition elevations. | The exact control arrangement varies; identify what was actually provided. |
The table is a reading aid, not a substitute for the methods section of a real assessment. A modified analysis may omit or combine conditions, so the contingency described in the stem outranks the label printed above a graph.
How should you read a functional analysis graph?
Read the graph in a fixed order. First identify the y-axis: frequency, rate, percentage, duration, latency, or another measure. Next identify the x-axis: sessions, trials, or condition sequence. Then compare the level and trend in each test condition with the control or comparison condition. Finally ask whether the pattern is replicated and differentiated enough to support the stated hypothesis.
A strong differentiated pattern is usually one in which responding is repeatedly higher in a test condition and relatively low in the control condition. If the highest data points occur in the attention condition while escape, tangible, and play remain lower, the diagram may support attention as a function under the tested arrangement. The word may matters: the conclusion should reflect the design, safety limits, data quality, and any competing patterns.
An undifferentiated graph shows similar responding across conditions. That does not mean “there is no function.” It may indicate that the test did not isolate the relevant variable, that the response measure was not sensitive, that multiple consequences are involved, or that the assessment requires a different design. A high pattern in more than one test condition can likewise suggest multiple control or a need for further analysis rather than a reason to choose the first elevated bar.
Do not read one data point as a conclusion. Look for repeated sessions, the separation between conditions, trend, variability, and the relation between the programmed contingency and the response. A graph with a high mean but extreme variability may deserve a more careful interpretation than a graph with slightly lower but consistently differentiated responding.
How is an FA diagram different from other assessment tools?
Many ABA resources use “functional assessment” broadly. An FA diagram is narrower because it represents experimental manipulation or a comparison designed to test a functional relation. A record review, interview, direct observation, or rating scale can contribute to assessment without being a functional analysis.
- Indirect assessment: gathers reports from caregivers, teachers, clients, or staff. It can identify patterns to investigate but does not by itself demonstrate a functional relation.
- Descriptive assessment: observes behavior as it naturally occurs and records antecedents and consequences. It describes correlations in the observed context; the analyst has not necessarily arranged the consequence.
- Functional analysis: systematically arranges conditions and compares behavior across them. The diagram should show the manipulated variable, the comparison condition, the response measure, and the resulting pattern.
- Functional behavior assessment (FBA): is the broader assessment process, which may include interviews, records, observations, and an FA when appropriate. It is not synonymous with one graph.
This boundary is useful when an exam stem gives you a completed questionnaire, a scatterplot, or a narrative ABC record and asks what it demonstrates. A questionnaire can suggest a hypothesis. An ABC record can reveal a recurring correlation. A differentiated FA graph can provide stronger experimental evidence for the conditions represented. Choose the answer that matches the evidence source instead of upgrading every assessment into an FA.
How should you solve a BCBA exam question?
Use the sequence label, contingency, data, conclusion:
- Label: identify the behavior, the conditions, the control or comparison, and the measurement on the diagram.
- Contingency: state what follows the target response in each test condition. Do not confuse a task, item, or person with the consequence.
- Data: compare repeated responding across conditions. Check level, trend, variability, and differentiation.
- Conclusion: select the narrowest statement supported by the pattern. Say “consistent with” when the evidence is bounded rather than claiming a universal cause.
Worked example: A graph shows high rates of disruption in the escape condition, low rates in play, and low-to-moderate rates in attention and tangible. The question asks what the pattern suggests. The best reasoning is that responding is differentiated in the escape test condition relative to play, so escape may be a relevant reinforcer under the tested arrangement. It is not correct to say that every episode of disruption is always maintained by escape, and it is not correct to call the play condition an intervention merely because rates are lower there.
A second scenario may show similar rates in attention and tangible, with both above play. The answer may be multiple control, an ambiguous or undifferentiated pattern, or the need for a more specific follow-up depending on the choices and the design. Do not force a single-function answer when the diagram does not isolate one. For extra practice, the free BCBA mock exam can be used to rehearse the label–contingency–data–conclusion sequence. It is a study resource, not a claim that the questions reproduce official BACB items.
What does the diagram not prove?
An FA diagram shows a controlled comparison, but its conclusion is still bounded. It does not prove that the behavior will have the same function in every person, setting, response form, or time period. It does not replace risk assessment, consent, clinical judgment, or current professional requirements, and it never justifies an unsafe arrangement merely to complete a familiar diagram.
The diagram may omit details that matter in practice, such as the response definition, safety procedures, treatment-integrity checks, or reason for a modified analysis. When those details are missing, describe what the graph supports and state what cannot be concluded from the picture alone.
Qualified professionals design assessments for the individual and follow current BACB standards, applicable law, organizational policy, and evidence-based safeguards. For exam purposes, this means selecting the interpretation that fits the described conditions without inventing a protocol that the question did not provide.
What are the common mistakes?
- Reading the title instead of the axes: confirm what is measured and how the conditions are labeled.
- Confusing antecedent and consequence: a demand can be the test context while escape is the suspected reinforcer.
- Ignoring the control condition: a high test value has less interpretive meaning without a comparison.
- Choosing the highest single bar: inspect replication, variability, and the overall pattern.
- Calling an interview an FA: indirect information can suggest a hypothesis but does not show experimental differentiation.
- Assuming the standard labels are universal: modified and individualized analyses may use different conditions or names.
- Overstating the result: write the conclusion at the level supported by the graph and its stated design.
Bottom line: To read a functional analysis diagram, identify the target behavior, locate the test and control conditions, trace the programmed contingency, inspect the data pattern, and state the narrowest defensible hypothesis. The visual is a map of a comparison—not a shortcut around operational definitions, repeated measurement, safety, or professional judgment.
Functional analysis diagram FAQ
What is a functional analysis diagram? It is a visual representation of the target behavior, assessment conditions, programmed consequences, comparison condition, measured data, and interpretation of a functional analysis. What should I look for first? Start with the behavior definition and the y-axis. Then locate the control condition and ask what changes in each test condition.
Does a high escape bar prove an escape function? It can support an escape-related hypothesis when the pattern is replicated and differentiated relative to the comparison condition. It does not prove that escape explains every instance across all contexts.
What does an undifferentiated FA graph mean? It means the tested conditions did not produce a clear separation in the displayed measure. Further interpretation may require reviewing the design, measurement, integrity, possible multiple control, or another assessment question.
Is an FBA the same as an FA? No. FBA is the broader assessment process. An FA is one experimental component that may be included when appropriate; an FA diagram represents the logic and data of that component.
What phrase helps on the BCBA exam? Remember: “compare the condition, not just the label.” The contingency and graph determine the answer more reliably than the color of a bar or the name printed above a box.
Sources and further reading: Review the BACB handbook, the clinical application review of functional-analysis methodology, the systematic approach to functional analysis, and the original Iwata functional-analysis study. These sources provide context; follow current official requirements and qualified professional guidance for real-world assessment.
Take the Free BCBA Mock Exam
When you are ready to apply the idea, use the free practice resource below for additional feedback. Take the Free BCBA Mock Exam



