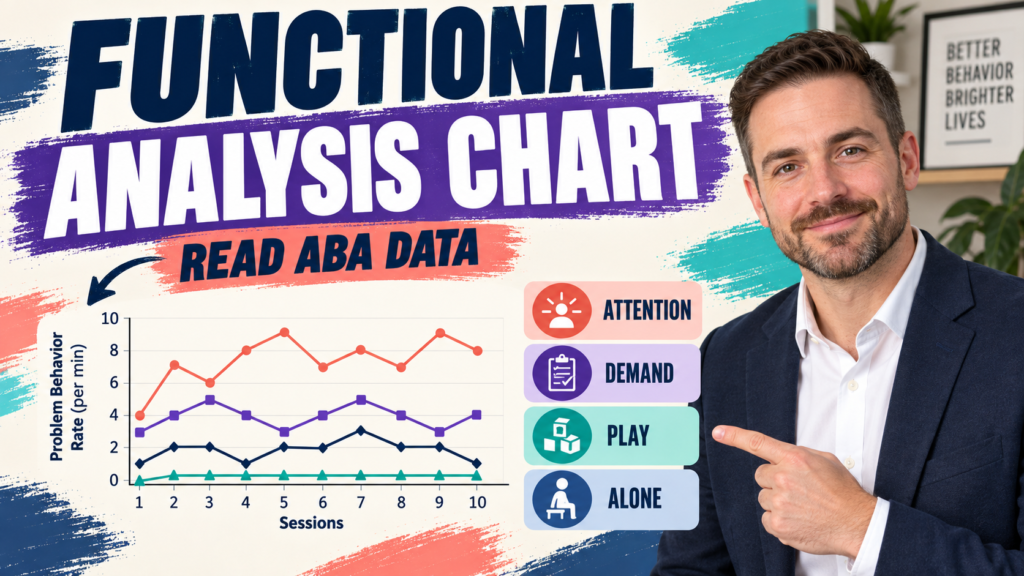
A functional analysis chart turns experimental assessment data into a visual comparison of conditions. The useful question is not simply which line is highest, but whether response patterns differ in a way that supports a functional hypothesis.
Table of Contents
- What Does a Functional Analysis Chart Show?
- How Are Conditions Labeled?
- How Do You Read a Functional Analysis Chart?
- What Counts as Differentiation?
- What Should You Record Before Interpreting?
- How Can a Chart Mislead You?
- What Does the BCBA Exam Test?
- What Is the Bottom Line?
- Quick Review Checklist
- Take the Free BCBA Mock Exam
A functional analysis chart usually displays a dependent measure, such as response rate, across conditions arranged to test competing reinforcers. Common labels may include attention, demand, alone, play, or a control condition, although the exact conditions depend on the assessment. Each point or bar summarizes performance under a defined condition. The chart is a compact record of what happened during the assessment; it is not a diagnosis by itself.
The BCBA Test Content Outline connects measurement and data-based decision-making with careful interpretation. When studying a graph, identify the response definition, the y-axis unit, the condition labels, and the experimental question before explaining the pattern.
What Does a Functional Analysis Chart Show?
The chart shows how the selected behavior changed across controlled conditions. If responding is consistently higher in an attention condition than in play and alone, that pattern may support attention as a relevant variable. If responding is highest during demands and falls when demands are removed, the chart may support an escape-related hypothesis. The inference depends on the procedures and the quality of the measurement, not on the color or height of a line alone.
Look for repeated sessions within each condition. One unusually high point can be noise, a setting event, or a measurement problem. A condition that repeatedly produces higher responding, while the control condition remains lower, is easier to interpret than a single isolated difference.
How Are Conditions Labeled?
Read the legend and phase separators before reading the trend. The same color may mean different things in different charts, so never infer a condition from color alone. Confirm whether the y-axis is frequency, rate, percentage, duration, or another measure. A bar labeled “10” could represent ten responses, ten responses per minute, or ten minutes of duration; those are not interchangeable.
| Chart feature | Question to ask | Common mistake |
|---|---|---|
| Y-axis | What dimension and unit is plotted? | Treating count as rate |
| Condition label | What event or contingency was arranged? | Guessing from color |
| Phase separator | When did the procedure change? | Ignoring condition order |
| Repeated points | Does the pattern replicate? | Overreading one point |
How Do You Read a Functional Analysis Chart?
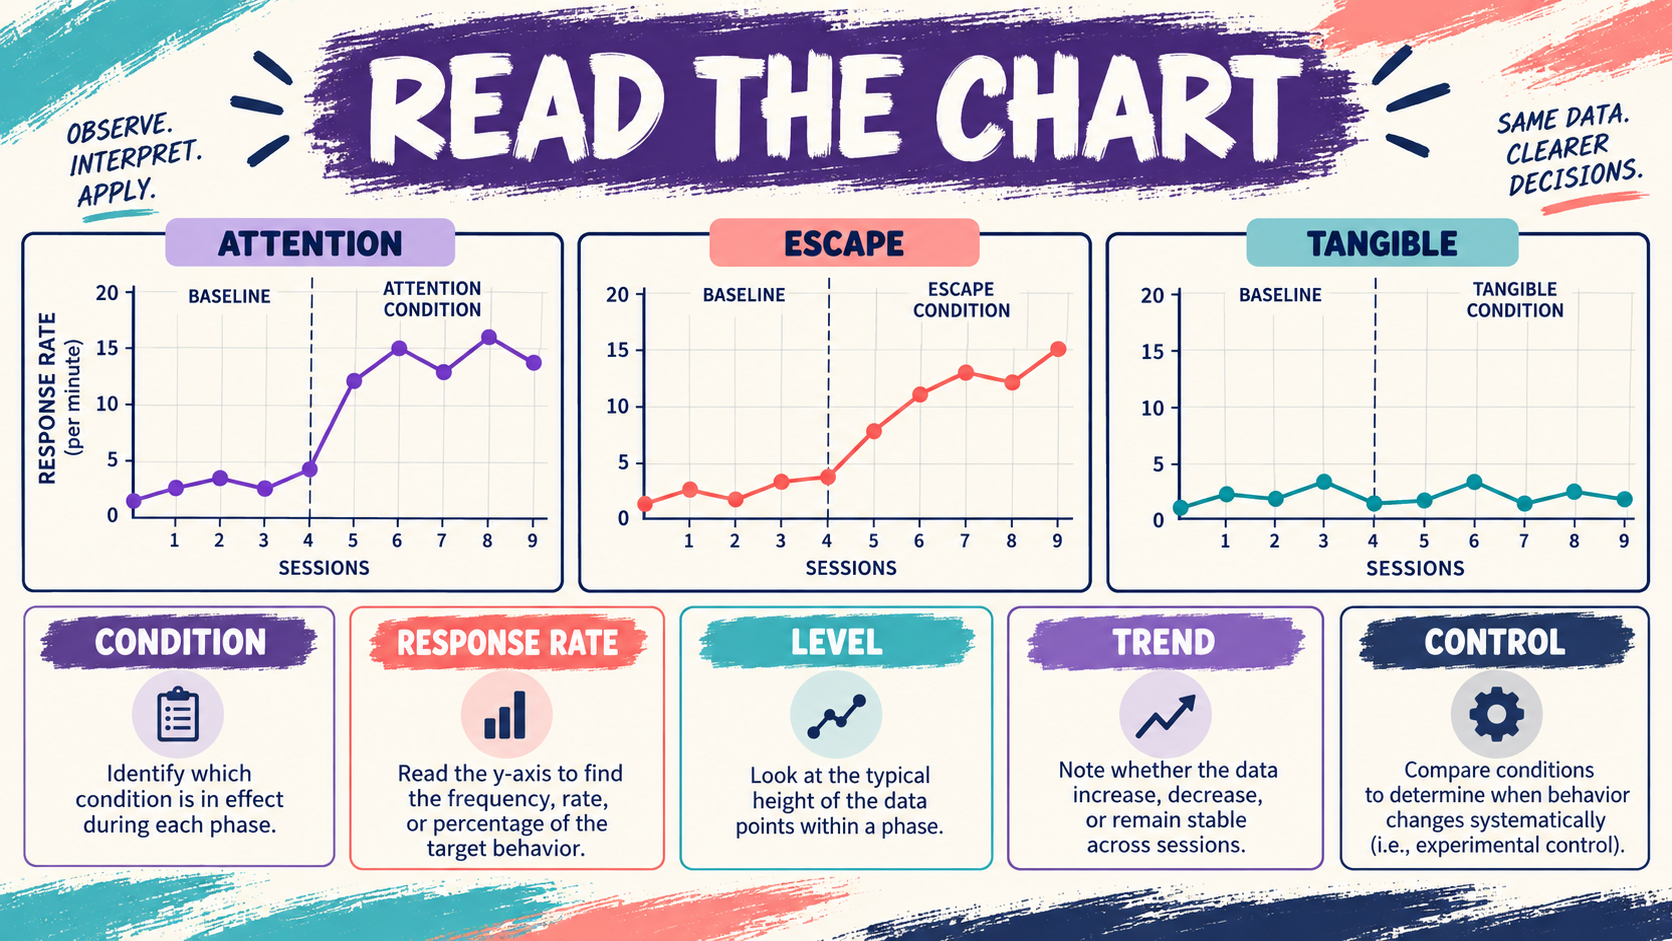
Start with level: which condition has the highest cluster of responses? Then inspect trend: are responses increasing, decreasing, or stable within that condition? Next inspect variability and overlap. A clear differentiation has a meaningful separation between the suspected test condition and the control condition, with relatively consistent results across sessions.
Read the graph left to right and connect the visual pattern to the assessment arrangement. If the demand condition is high only after the learner is tired, the result may reflect a setting event rather than the demand contingency. If the attention condition includes longer sessions, compare rates rather than raw counts. Good chart reading always returns to the numerator, denominator, and procedure.
What Counts as Differentiation?
Differentiation means the behavior occurs at meaningfully different levels across conditions. The strongest pattern is often high responding in one test condition and low responding in a control condition. But a small difference may still matter if it is consistent and the behavior is dangerous; a large visual difference may be less convincing if measurement or implementation was unstable.
Do not confuse a high level with a confirmed function. A high attention condition supports an attention hypothesis only when attention was arranged as the relevant consequence and competing explanations are controlled. The chart summarizes the assessment; the analyst still needs to consider procedural fidelity, medical variables, access to reinforcement, and the person’s safety.
What Should You Record Before Interpreting?
- Response definition: know exactly what counted as one response.
- Measurement dimension: identify whether the chart uses rate, frequency, duration, or percentage.
- Condition procedure: know what consequence or event was arranged in each condition.
- Session context: note unusual events, health concerns, schedule changes, or interruptions.
How Can a Chart Mislead You?
Different scales can exaggerate or minimize visual differences. A truncated y-axis may make a small change look dramatic, while a very broad axis may hide a clinically important pattern. Unequal session lengths can make raw counts look different even when rates are similar. A line that connects unrelated conditions can also imply continuity that did not exist.
Measurement drift is another problem. If observers gradually count more or fewer responses, the graph may show an apparent trend that belongs to the observer rather than the learner. Use training, clear definitions, and agreement checks when decisions depend on a close comparison.
What Does the BCBA Exam Test?
- Highest is not enough: explain the condition and the repeated pattern.
- Rate needs time: a count without an observation interval is not a rate.
- Control matters: compare test conditions with a meaningful control condition.
- Correlation is not function: the chart supports a hypothesis only within the assessment logic.
- Labels matter: identify the behavior and condition before interpreting the line.
- Ethics matters: assessment procedures must protect the person and use the least risky reasonable arrangement.
What Is the Bottom Line?
A functional analysis chart is a visual comparison of response patterns under arranged conditions. Read the axes, labels, phase changes, level, trend, and replication before naming a functional hypothesis. For more practice with measurement and graph interpretation, try the free BCBA mock exam. It is study support, not a substitute for individualized assessment or supervision.
For targeted review, use our functional analysis chart practice questions to apply the concept in exam-style scenarios.
Quick Review Checklist
Use this final checklist to turn functional analysis chart into exam-ready reasoning. The goal is not to memorize a label in isolation; it is to identify the relevant evidence and explain why the best answer fits the scenario. Key ideas to review:
- State the central definition or decision point for functional analysis chart in your own words.
- Identify the detail that makes functional analysis chart different from its closest related ABA term.
- Separate the observable facts in a scenario from assumptions that are not supported by the facts.
- Write one example and one nonexample so you can recognize the concept in a new setting.
Exam application checks:
- Ask what the question is actually requesting before comparing the answer choices.
- Mark the antecedent, response, consequence, or other evidence that supports the selected answer.
- Look for a distractor that describes a related process but does not answer the specific question.
Final self-check:
- Explain how you would verify the interpretation with clear observations or data.
- Change one detail in the scenario and decide whether your answer should change.
- Give a one-sentence rationale that a supervisor or study partner could evaluate.
Take the Free BCBA Mock Exam
If you want a low-pressure way to check your recall, use the free practice resource below. Take the Free BCBA Mock Exam