
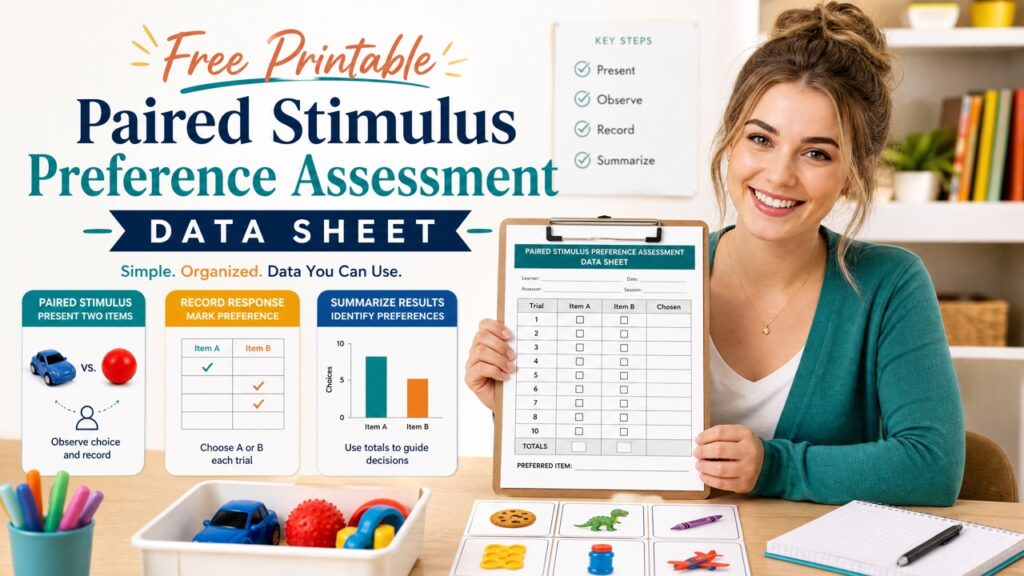
A paired stimulus preference assessment data sheet is a structured tool for recording trial-by-trial selections during a paired stimulus preference assessment. It helps you capture which stimulus the learner selects when two items are presented together, calculate the selection percentage for each stimulus, and build a preference hierarchy. This article provides a free printable template, instructions for accurate recording, the formula for scoring, graphing guidance, and practical considerations for using the data sheet in your behavior-analytic practice.
Table of Contents
- What Is a Paired Stimulus Preference Ass
- The Free Printable Data Sheet Template
- How to Calculate Selection Percentage
- How to Graph Results and Interpret a Preference Hierarchy
- Recording Instructions and Tips for Accurate Data
- Session Length, Stimuli Number, and Adaptations
- Handling Ties and Position Bias
- Ethical Considerations and Professional Practice
- Common Traps to Avoid
- Study Checklist for Effective Implementation
What Is a Paired Stimulus Preference Ass
A paired stimulus preference assessment is a procedure in which two stimuli are presented simultaneously, and the learner is asked to choose one. The assessment is repeated across multiple trials, with each stimulus paired with every other stimulus at least once. The goal is to identify stimuli that may function as reinforcing for the individual. It is important to understand that this assessment identifies potential reinforcers; it does not demonstrate that a stimulus is reinforcing. A separate reinforcer assessment, such as a contingency test, is needed to verify whether a stimulus actually functions as a reinforcer for a specific behavior.
This method is useful when you need to compare a moderate number of stimuli (typically 6–8) and when the learner can reliably select between two options. Compared to single-stimulus presentations, the paired format forces a choice and can yield a clearer ranking of preferences. However, it may not be suitable for learners with strong side biases or those who become fatigued quickly. In such cases, alternative methods like multiple stimulus without replacement (MSWO) or free operant observation may be more appropriate.
The Free Printable Data Sheet Template
Below is a printable data sheet template with columns for date, trial number, the stimuli presented (left/right), the stimulus selected, and notes. This structure supports trial-by-trial recording, which is essential for accurate data collection. Copy the table into a word processor or print it directly for your sessions.
| Trial | Date | Stimuli Presented (Left / Right) | Selection (Circle One) | Notes |
|---|---|---|---|---|
| 1 | 01/15 | Ball / Car | Ball / Car | Chose quickly |
| 2 | 01/15 | Book / Puzzle | Book / Puzzle | Hesitated |
| 3 | 01/15 | Car / Book | Car / Book | Looked at both |
| 4 | 01/15 | Puzzle / Ball | Puzzle / Ball | Selected immediately |
Instructions for using the template: Record the date at the top of the page. For each trial, list the two stimuli in the order they are presented left and right. Circle or mark the stimulus the learner selects. If the learner makes no selection within a few seconds, record that in the notes and consider repeating the trial later. Continue until you have presented each pairing the predetermined number of times (often twice, once with each left/right order). Use a timer to keep the inter-trial interval consistent and to avoid rushed decisions.
How to Calculate Selection Percentage
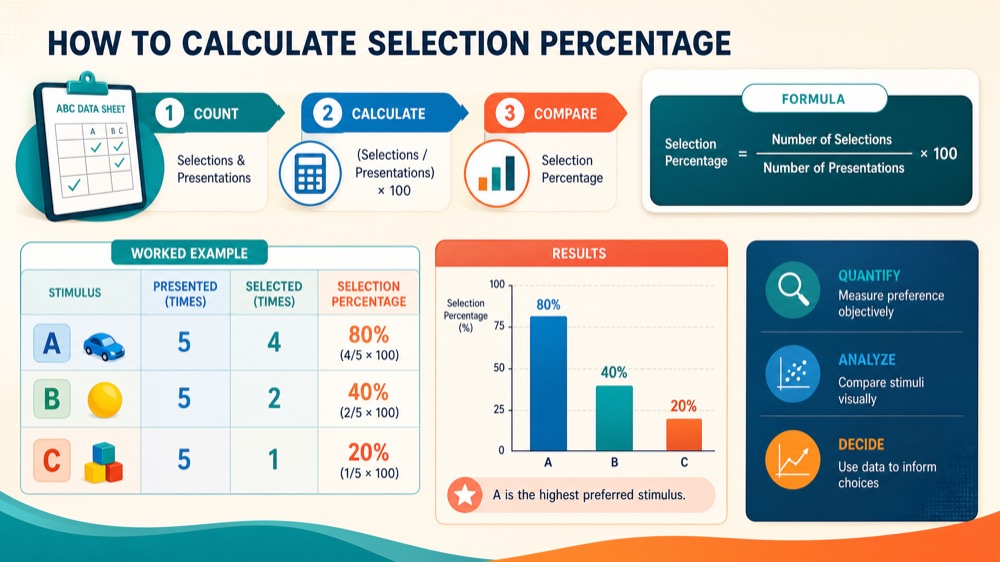
To quantify preference, calculate the selection percentage for each stimulus using the formula: (number of selections / number of presentations) × 100. For example, if Stimulus A was presented 5 times and selected 4 times, the selection percentage is (4/5) × 100 = 80%. This percentage provides a comparable measure across stimuli, even if they were not presented the exact same number of times due to counterbalancing. Always record both the number of presentations and selections on your data sheet to ensure accurate calculation.
Worked Example: Assume you assessed three stimuli: A, B, and C. You presented each pair twice (once with each stimulus on the left), resulting in each stimulus being presented 4 times. Suppose Stimulus A was selected 4 times out of 4 presentations (100%), Stimulus B was selected 2 times out of 4 (50%), and Stimulus C was selected 1 time out of 4 (25%). This yields a clear hierarchy: A > B > C. Use this example to understand how to compute percentages from your own data.
How to Graph Results and Interpret a Preference Hierarchy
Graphing your results helps visualize the preference hierarchy. Create a bar graph with stimulus names on the x-axis and selection percentage on the y-axis. Each bar represents the selection percentage for a stimulus, plotted from highest to lowest to make the hierarchy visually obvious. For instance, if A is 100%, B is 50%, and C is 25%, the bars will show A tallest, then B, then C. The graph allows you to quickly see which stimuli are most and least preferred, guiding which items to test as potential reinforcers.
When interpreting the graph, look for clear gaps between bars. If two stimuli have similar percentages (e.g., 80% and 75%), the difference may not be meaningful; treat them as equally preferred. Use the hierarchy to select a range of stimuli for further testing. If you see a flat graph (all percentages around 50%), preferences may be weak, or the learner may be selecting randomly. In that case, consider reassessing with a different set of stimuli or using a different assessment format.
Recording Instructions and Tips for Accurate Data
Accurate data collection is critical for a valid preference assessment. Follow these instructions to ensure reliable results:
- Record immediately: Do not rely on memory. Mark the selection as soon as the learner chooses, ideally while the trial is still ongoing.
- Use a timer: Keep a consistent trial duration (e.g., 5 seconds) and inter-trial interval (e.g., 5–10 seconds) to standardize administration.
- Counterbalance positions: Alternate the left/right position of each stimulus across repeated trials to control for position bias. For example, if pair AB is presented with A on the left first, present it again with A on the right.
- Randomize pair order: Shuffle the order of pairs across sessions to prevent order effects.
- Record non-selections: If the learner does not select either stimulus, note it and decide whether to repeat the trial or exclude it from the analysis.
- Keep the data sheet accessible: Have it on a clipboard or screen so you can record without interrupting the flow.
Session Length, Stimuli Number, and Adaptations
Session length and the number of stimuli depend on the learner’s age and tolerance. A typical session lasts about 5 minutes or consists of a set number of trials (e.g., 10–20). For most learners, using 6–8 stimuli is manageable. With 6 stimuli, there are 15 unique pairs; if you present each pair twice for counterbalancing, that is 30 trials, which may be too long for some. In such cases, you might present each pair once and alternate positions across different pairs, or reduce the number of stimuli. Always watch for signs of satiation (declining engagement) or fatigue. If the learner becomes restless, shorten the session or take breaks. Adapt the procedure to the individual’s needs while maintaining the essential structure.
Handling Ties and Position Bias
Ties in selection percentages can occur. If two stimuli have the same selection percentage, you have several options:
- Present the tied pairs again to see if one emerges as more preferred.
- Use a secondary measure, such as the latency to select (faster selection may indicate stronger preference) or the number of times the stimulus was selected when it was presented last.
- Conduct a brief reinforcer assessment for the tied stimuli to see which one maintains behavior better.
Position bias occurs when the learner consistently selects the stimulus on a particular side regardless of which stimulus is there. This can inflate the selection percentage for stimuli placed on that side. Counterbalancing left/right positions across trials is the primary control. If you notice a strong side bias (e.g., the left item is chosen on 80% of trials), re-evaluate the data. You can calculate a side-bias index: number of left selections divided by total trials. If it deviates significantly from 50%, consider adjusting your procedures or using a different assessment format.
Ethical Considerations and Professional Practice
Conducting a preference assessment involves ethical responsibilities. Always obtain informed consent from caregivers and assent from the learner as appropriate, following the BACB Ethics Code (e.g., standard 2.11). Use a variety of stimuli based on stakeholder input to ensure you are assessing items that are meaningful to the learner. The data you collect should inform therapy decisions, but you must not overstate what a preference assessment demonstrates. Clearly document that the results are preliminary and that reinforcement must be verified. Respect the learner’s dignity by not forcing choices and ensuring that the assessment is enjoyable. Also, avoid items that may be unsafe or inappropriate; your clinical judgment should guide stimulus selection.
Common Traps to Avoid
- Treating preference as reinforcement: A high selection percentage does not prove that the stimulus will function as a reinforcer. Always verify with a reinforcer assessment.
- Ignoring position bias: Failing to counterbalance can lead to false conclusions about preference.
- Inconsistent trial administration: Varying the time between trials or the way you present stimuli can affect results.
- Not recording immediately: Waiting until the end of the session can lead to errors.
- Overinterpreting small differences: A 10% difference may not be significant; treat close percentages as ties.
Study Checklist for Effective Implementation
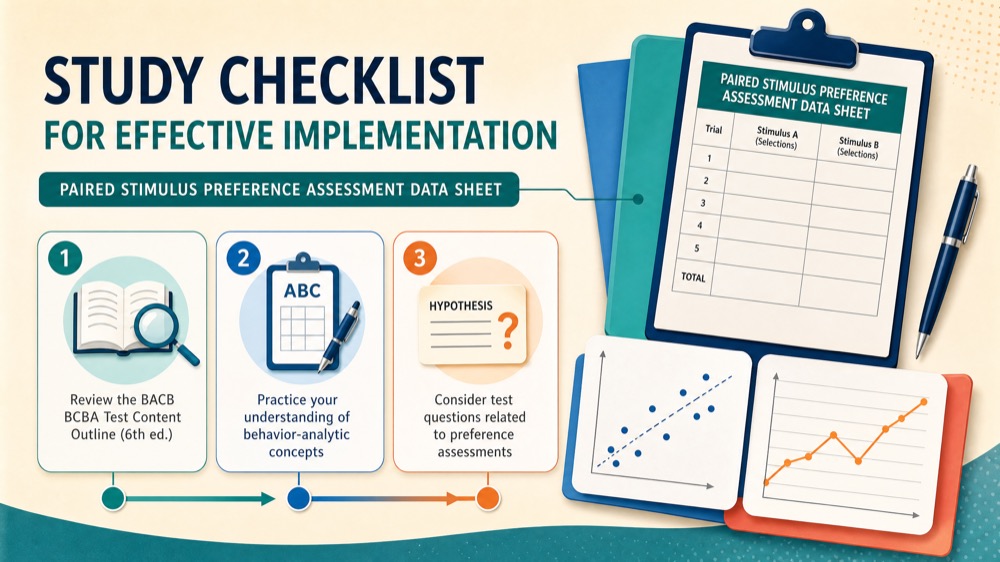
Before you use this data sheet, review the following checklist to ensure you are prepared:
- Can you define a paired stimulus preference assessment and its purpose?
- Do you know how to calculate selection percentage?
- Can you graph and interpret a preference hierarchy?
- Understand why counterbalancing is necessary and how to implement it.
- Know the difference between preference assessment and reinforcer assessment.
- Be able to discuss ethical considerations such as assent and stakeholder input.
For further study, review the BACB BCBA Test Content Outline (6th ed.) for tasks related to preference assessments. To practice your understanding of behavior-analytic concepts, consider taking our free BCBA mock exam, which offers practice questions with feedback to help you gauge your readiness.
Remember, a paired stimulus preference assessment is just one tool in your assessment toolkit. Use it wisely, record accurately, and always follow up with reinforcer verification. Download the printable data sheet, practice with sample data, and you will be prepared to implement this procedure confidently in your practice.



