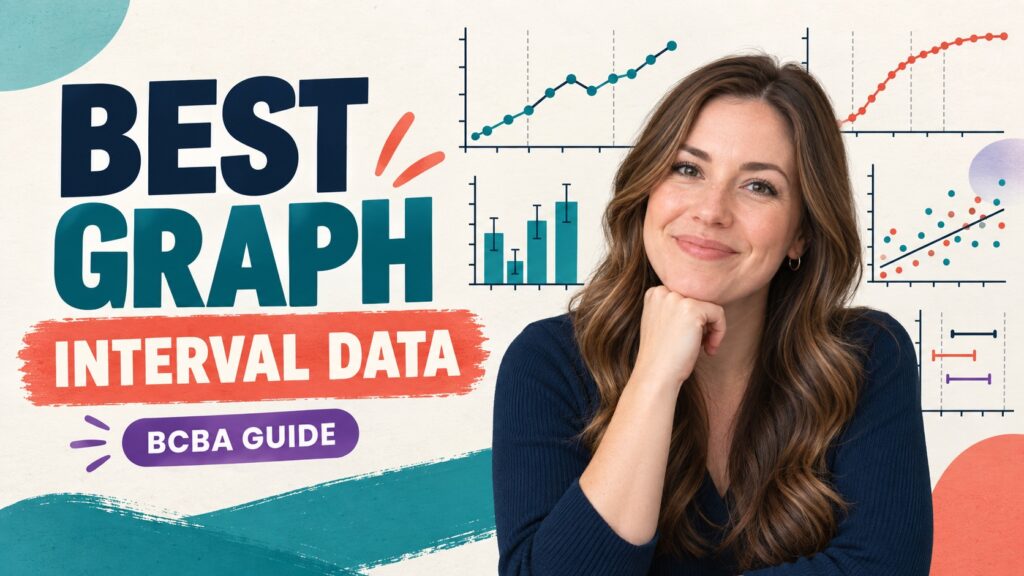
Short answer: For interval data collected across repeated sessions, an equal-interval line graph is usually the best starting point because it shows change over time, level, trend, and variability. A bar graph may be better when the question is a compact comparison among separate conditions or categories. The best graph for interval data depends on the decision the display must support, not on the word “interval” alone.
Table of Contents
- What does interval data represent?
- What is the best graph for interval data?
- When is an equal-interval line graph the best choice?
- When is a bar graph more useful?
- When should you consider other displays?
- How do you choose a graph in a BCBA exam scenario?
- What does the BCBA exam expect you to recognize?
- What graphing mistakes should you avoid?
- A quick graph-selection checklist
- Best graph for interval data FAQ
- Take the Free BCBA Mock Exam
Interval recording tells you whether a behavior occurred during defined observation intervals, but it does not by itself determine the display. Partial-interval, whole-interval, and momentary time-sampling data can all be summarized as percentages or other interval-based measures. Before choosing a graph, identify the measurement procedure, the time structure, the number of conditions, and whether the team needs ongoing visual analysis or a summary comparison.
This guide focuses on graph selection. It does not duplicate a basic definition of an interval graph. It gives a BCBA-friendly decision path, explains when line, bar, cumulative, scatterplot, or other displays fit the question, and highlights the exam traps that make a technically neat graph misleading. Table of Contents
What does interval data represent?
Interval recording divides an observation period into equal segments and records whether the target behavior met the rule for each segment. In partial-interval recording, the behavior is scored if it occurs at any point during the interval. In whole-interval recording, it must occur throughout the interval. In momentary time sampling, the observer checks whether the behavior is occurring at a specified moment. Each procedure answers a slightly different question, so the graph must preserve that meaning.
A common summary is the percentage of intervals scored positive. That calculation can be useful, but it is not the same as frequency, duration, or the exact number of responses. Partial-interval recording can overestimate the amount of time a behavior occurred because one brief response can make an entire interval positive. Whole-interval recording can underestimate occurrence when the behavior stops briefly. A graph title, y-axis label, and note should identify what was measured.
Think of the data display as a communication tool. If a BCBA needs to decide whether behavior changes after a phase change, the display should make the time pattern visible. If a team needs to compare average percentages across three settings, a summary display may be clearer. “Interval data” describes how the observation was recorded; “best graph” describes how the resulting values should be interpreted.
What is the best graph for interval data?
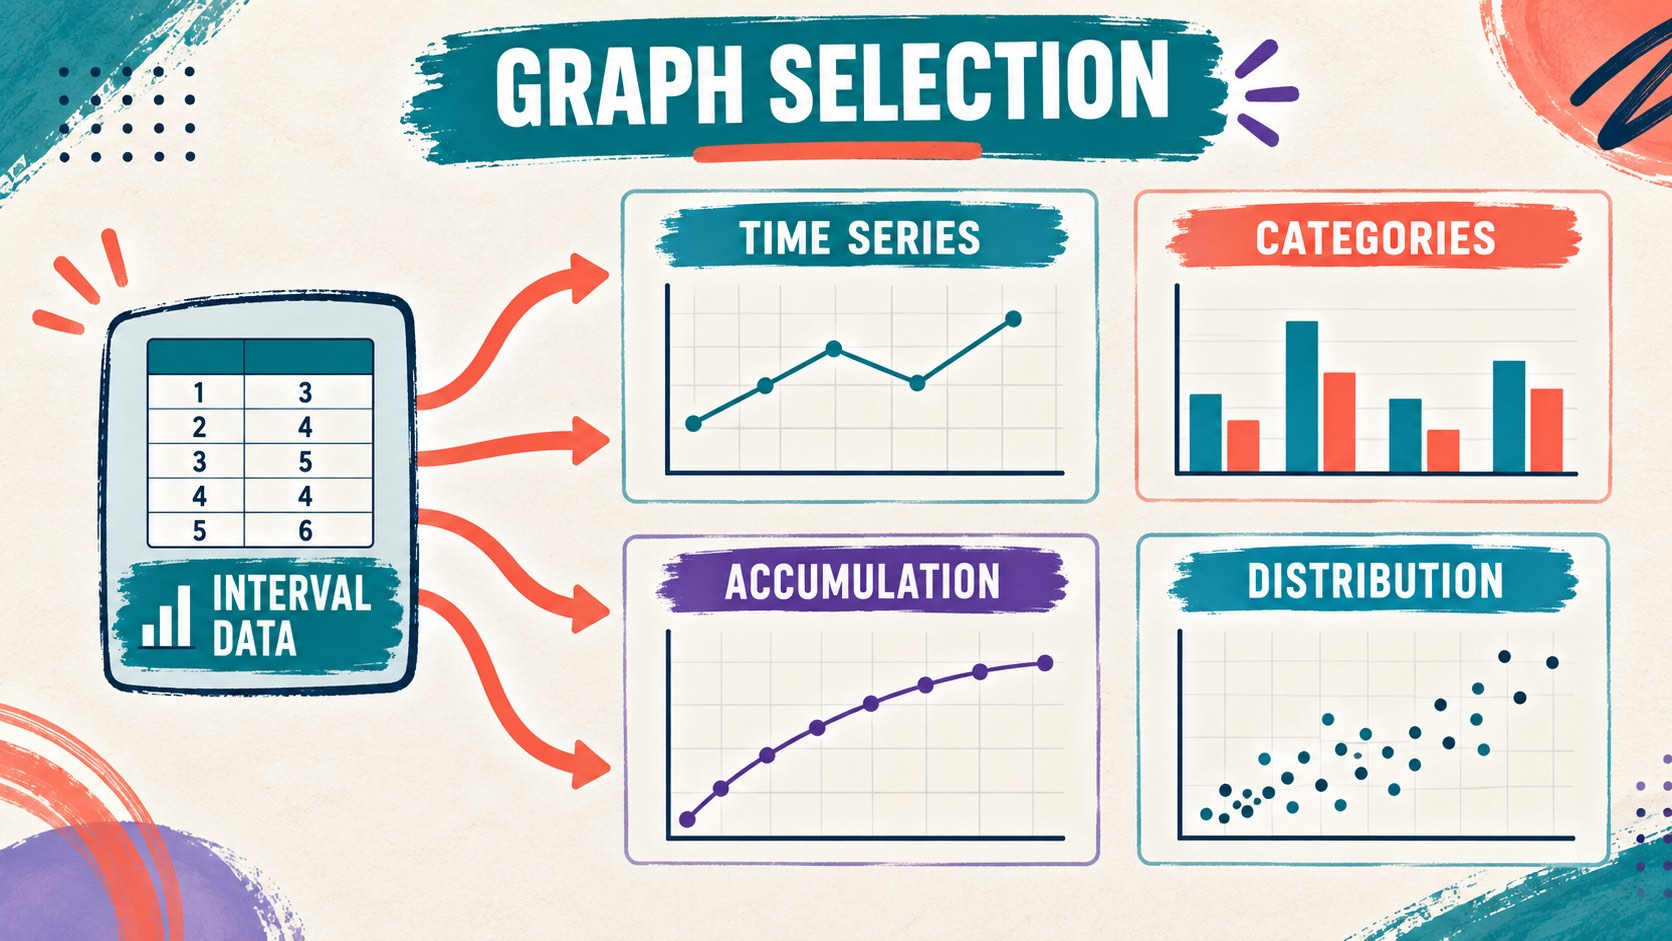
For most interval data collected session by session, choose an equal-interval line graph. Put sessions or observation periods in chronological order on the x-axis, and put the derived measure—such as percentage of intervals with behavior—on the y-axis. Use equal physical spacing for equal units of time or sessions. Add phase-change lines and labels when the design includes baseline, intervention, maintenance, or generalization phases.
That default changes when the question is not about a time series. Use a bar graph when the main purpose is to compare summary values across distinct categories, such as different classrooms or conditions. The bar does not make a time trend visible as naturally as a line graph. If the data are cumulative counts, use a cumulative record. If the purpose is to identify when behavior clusters across time and activities, a scatterplot may be more informative than either a line or bar graph.
| The question you need to answer | Usually appropriate display | Why |
|---|---|---|
| Did the percentage change across sessions? | Equal-interval line graph | Connects ordered observations and reveals level, trend, and variability. |
| Which separate condition has the higher summary value? | Bar graph | Makes discrete category comparisons easy to scan. |
| How does a total accumulate over time? | Cumulative record | The slope communicates local rate while the height shows accumulated count. |
| When does behavior occur across activities or times? | Scatterplot | Shows the distribution of occurrences across time blocks or contexts. |
When is an equal-interval line graph the best choice?
An equal-interval line graph is the strongest choice when the team needs to see behavior change over an ordered sequence of sessions or days. It supports visual analysis by showing the data path rather than hiding the pattern inside a single average. A line graph can help a BCBA inspect level, trend, variability, immediacy of change, overlap, and consistency across phases.
For example, suppose partial-interval data show the percentage of intervals in which calling out occurred during 12 classroom sessions. A line graph can show whether the percentage declined after an intervention, whether the decline was immediate, and whether later sessions remain stable. If the data bounce between very high and very low values, the variability is part of the decision. Replacing the series with one bar for “before” and one bar for “after” may hide the instability that matters for treatment planning.
Use a clear y-axis that matches the calculation. “Percentage of intervals with calling out” is more informative than “behavior.” Include the observation period, interval length, recording method, and phase labels in the graph or its accompanying note. A line connecting values does not mean the behavior occurred continuously between sessions; it simply helps the reader see the ordered data path.
- Choose the line graph when observations are ordered by session, day, or another meaningful time unit.
- Use equal spacing when equal units are being compared.
- Label phase changes rather than letting a visual gap imply an unexplained event.
- Keep the measurement definition visible so “higher” or “lower” has the correct meaning.
When is a bar graph more useful?
A bar graph is useful when the main question is a comparison among discrete categories, not a continuous or session-by-session trend. You might compare the mean percentage of positive intervals across three settings, the percentage for two independent conditions, or a summary value for different tasks. The categories should be meaningful, and the summary statistic should be stated.
Do not choose a bar graph simply because the data came from interval recording. If the team is monitoring change over time, a bar graph can make the display less sensitive to trend and variability. A bar may be appropriate as a secondary summary, but it should not replace the primary time-series display when the intervention decision depends on session-level patterns.
| Feature | Equal-interval line graph | Bar graph |
|---|---|---|
| Primary use | Time-series change and visual analysis | Comparison of separate categories or summarized conditions |
| Strength | Shows level, trend, variability, and phase relation | Makes category differences visually immediate |
| Main risk | A connected line may be mistaken for continuous behavior | Averages can hide time order and variability |
When should you consider other displays?
Some questions cannot be answered well with either a standard line graph or a bar graph. Match the display to the dimension and decision:
| Display | Best fit | Caution |
|---|---|---|
| Cumulative record | Cumulative count and rate shown through slope | The line does not go down when no new responses occur; it becomes flat. |
| Scatterplot | Checking when or where behavior is more likely across routines | It identifies distribution and possible patterns, not a demonstrated functional relation by itself. |
| Standard celeration chart | Specialized frequency-per-time analysis and learning progress | Use the scale and conventions consistently; it is not the default answer for every interval question. |
How do you choose a graph in a BCBA exam scenario?
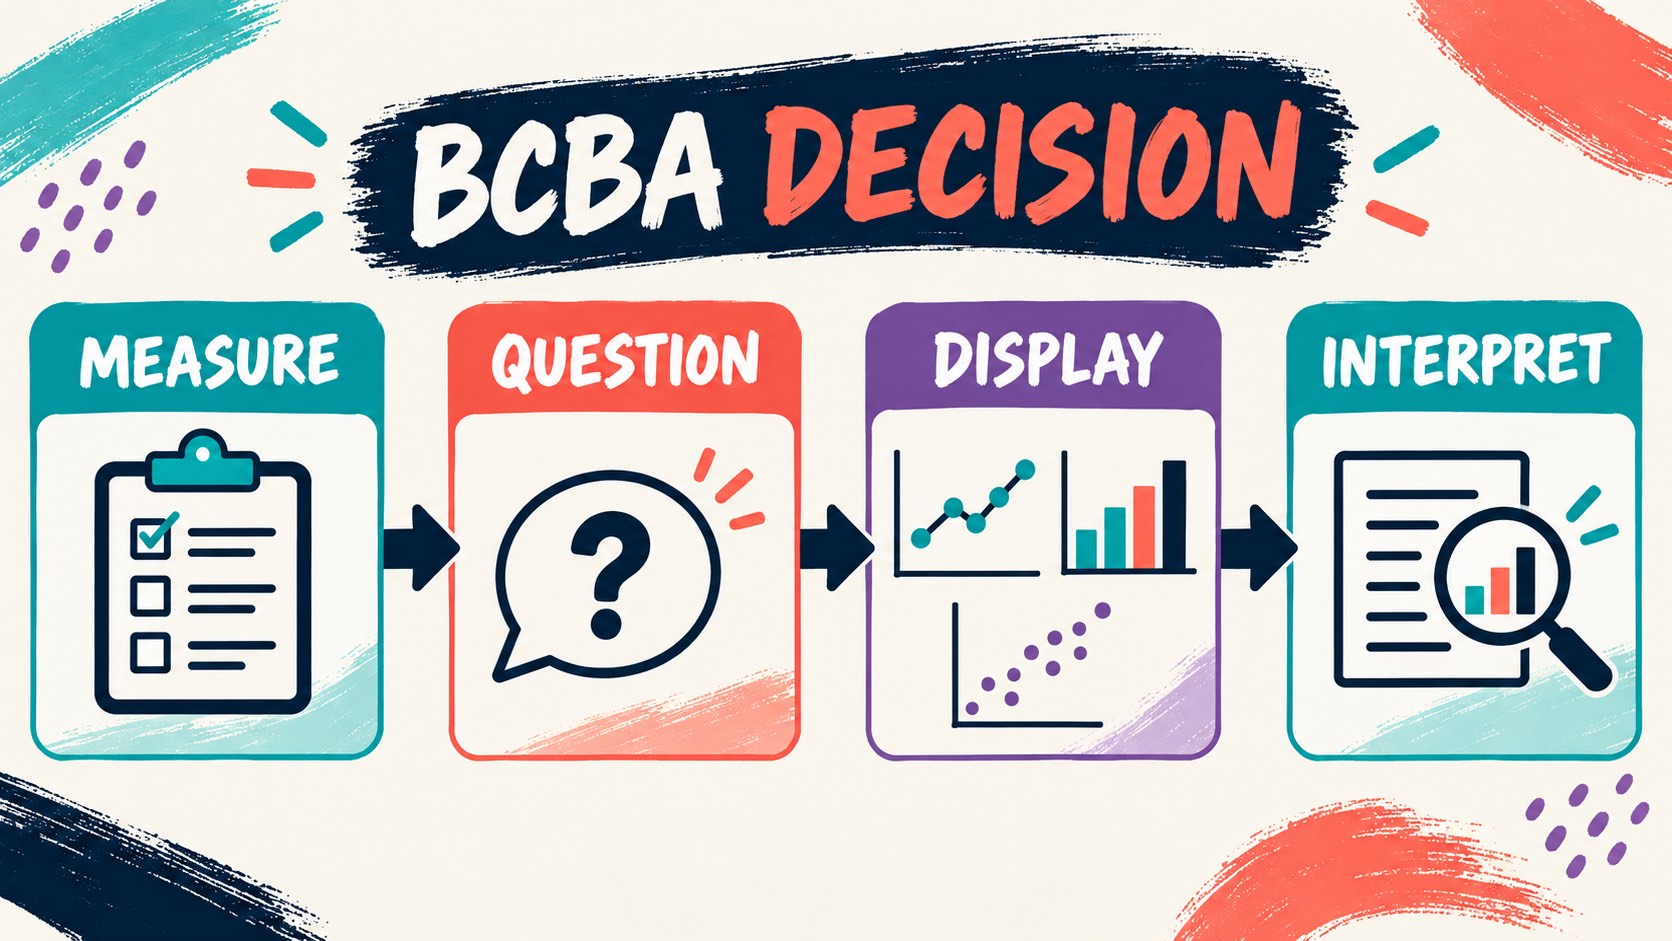
Start by asking what the question wants you to communicate. Consider this example: an observer records partial-interval percentages during baseline and intervention across 15 sessions. The stem asks whether the intervention changed the behavior and whether the change was immediate and consistent. The correct first choice is an equal-interval line graph because the decision depends on the time series and phase relation.
Now change the question: the observer has already summarized the average percentage of positive intervals for three independent classroom settings and asks which setting has the highest summary value. A bar graph may be the clearest display because the categories, not the session-by-session path, are the focus. If the stem instead asks when behavior is most likely during the school day, a scatterplot may fit better because time blocks and activities are the variables of interest.
| Scenario wording | Best match | Reasoning cue |
|---|---|---|
| “Across baseline and treatment sessions” | Equal-interval line graph | Preserve time order and phase changes. |
| “Compare the average percentage by classroom” | Bar graph | Compare discrete categories after summarizing. |
| “Identify the time of day when behavior clusters” | Scatterplot | Map occurrence across time blocks and routines. |
What does the BCBA exam expect you to recognize?
The BACB BCBA Test Content Outline includes selecting and applying discontinuous measurement procedures and graphing data to communicate quantitative relations. Those tasks support a decision rule: first identify what the measurement represents, then select the display that makes the relevant relation visible. The outline is an official content framework, not a promise about exact question wording.
On an exam item, watch for whether “interval” describes the recording method or whether it describes the x-axis. An interval recording procedure can yield a percentage plotted across sessions. The word “interval” does not automatically mean “bar graph,” and the word “percentage” does not automatically mean “pie chart.” The answer should match the measurement, time structure, and decision.
What graphing mistakes should you avoid?
- Choosing by the data-collection label alone: interval recording does not force one display in every context.
- Hiding the time series in averages: a summary bar can conceal variability and phase timing.
- Using unequal spacing: the visual distance should respect the units being compared.
- Forgetting the measurement rule: partial, whole, and momentary sampling do not mean the same thing.
- Interpreting direction without the target: a lower partial-interval percentage may be improvement for a behavior targeted for decrease, while a higher whole-interval percentage may be improvement for an on-task behavior.
A quick graph-selection checklist
Before finalizing the display, answer these questions:
- What exact dimension did the observer measure or calculate?
- Are observations ordered over time, separated into categories, or arranged by context?
- Does the decision require level, trend, variability, accumulated count, or distribution?
- Could the title and axis labels be understood without guessing the interval method?
Best graph for interval data FAQ
Is a line graph always the best graph for interval data?: No. It is usually the best starting point for interval data collected across sessions, but a bar graph may be more appropriate for discrete category summaries, and other displays may fit cumulative or distribution questions.
What should go on the y-axis?: Put the derived measure that matches the recording procedure, such as percentage of intervals with the behavior. Do not label the axis only “interval data” because that does not tell the reader what the values mean.
Does partial-interval recording measure duration?: Not directly. Partial-interval recording scores whether the behavior occurred at any point in each interval. It can be useful for detecting occurrence, but it may overestimate the amount of time the behavior was present.
Can I use a bar graph for baseline and intervention?: You can use a bar graph for a summary comparison when that is the stated purpose, but a line graph usually preserves more information when the decision depends on session-by-session change, variability, and phase timing.
Quick review: define the measurement, identify whether the question is about time, categories, accumulation, or distribution, and choose the display that makes that relation visible. For a broader overview, review the ABA graphs BCBA exam guide; for targeted practice, try a best graph for interval data practice question. The practice resource is not an official BACB exam and does not guarantee certification or a passing result.
Take the Free BCBA Mock Exam
When you are ready to apply the idea, use the free practice resource below for additional feedback. Take the Free BCBA Mock Exam