

Short answer: A behavior intervention plan flow chart is a visual sequence that shows how assessment evidence becomes a function-based plan, how the team implements it, and how data lead to the next decision. A useful chart does not jump from “problem behavior” to “consequence.” It moves from a clear concern and functional assessment to a competing behavior pathway, prevention, teaching, reinforcement, response procedures, safety when needed, implementation, monitoring, and generalization.
Table of Contents
- What is a behavior intervention plan flow chart?
- Where should the BIP flow chart start and end?
- What are the main steps in a BIP flow chart?
- Which decision points change the flow?
- What does a BIP flow-chart example look like?
- How should the team monitor and revise the plan?
- What are common BCBA exam traps?
- Behavior intervention plan flow chart FAQ
- Take the Free BCBA Mock Exam
For the BCBA exam, treat the flow chart as a reasoning map rather than a universal legal form. The exact school-team process, consent rules, documentation requirements, and safety procedures depend on the setting and current policy. The chart helps you see the order and relationships among decisions; it does not replace individualized assessment, supervision, clinical judgment, or the current requirements of the BACB and the relevant organization. Table of Contents
What is a behavior intervention plan flow chart?
A BIP flow chart is a visual model of the planning process. Each box represents a meaningful action or decision, and each arrow shows what information should be available before the team moves forward. In applied behavior analysis, the most important connection is between the function suggested by assessment and the strategies selected for prevention, teaching, reinforcement, and response.
The chart should make the logic visible. If a learner engages in a behavior to escape a difficult task, the plan may need an antecedent adjustment, a way to request help or a break, instruction in the replacement response, and reinforcement for using that response. If the function is attention, the teaching and reinforcement arrangement may look different. A list of consequences without this functional connection is not a strong flow chart.
The BACB BCBA Test Content Outline places behavior assessment, measurement, intervention, and data-based decision-making in separate but connected areas of competence. That is why an exam question may test more than whether you can name “BIP.” You may need to identify the missing assessment step, select a function-matched intervention, recognize a fidelity problem, or choose the next action from a progress graph.
A flow chart is not the same as a completed BIP. The finished plan must contain operational definitions, individualized procedures, responsible people, measurement details, training expectations, safety boundaries when relevant, and a review process. A chart organizes those elements; it does not invent them.
Where should the BIP flow chart start and end?
Start with a behavior concern that has been described well enough to investigate. “Noncompliance” or “is disruptive” may be a referral label, but the team still needs an observable definition, relevant context, and information about what happens before and after the response. The first step is not choosing a punishment or downloading a template.
The assessment branch should collect information that can support a behavioral hypothesis. Depending on the question and setting, this may include interviews, record review, direct observation, ABC observations, descriptive measurement, preference information, or a functional analysis conducted by qualified professionals. Descriptive patterns can inform a hypothesis, but a flow chart should not present a descriptive consequence as proof of function.
End with a feedback loop rather than a final box labeled “finished.” The team needs to ask whether the plan was implemented, whether the target and replacement behaviors changed, whether the measurement system was usable, and whether the effects generalized across people, activities, and settings. The next arrow may lead to maintenance, a small plan adjustment, more assessment, consultation, or a new safety review.
- Input: a defined concern, context, baseline information, and assessment evidence.
- Design: function-based prevention, teaching, reinforcement, response, and safety decisions.
- Implementation: trained people, feasible steps, communication, materials, and a start point.
- Evaluation: outcome data, replacement-behavior data, treatment-integrity data, and stakeholder feedback.
- Next action: maintain, generalize, revise, reassess, consult, or fade components when justified.
What are the main steps in a BIP flow chart?
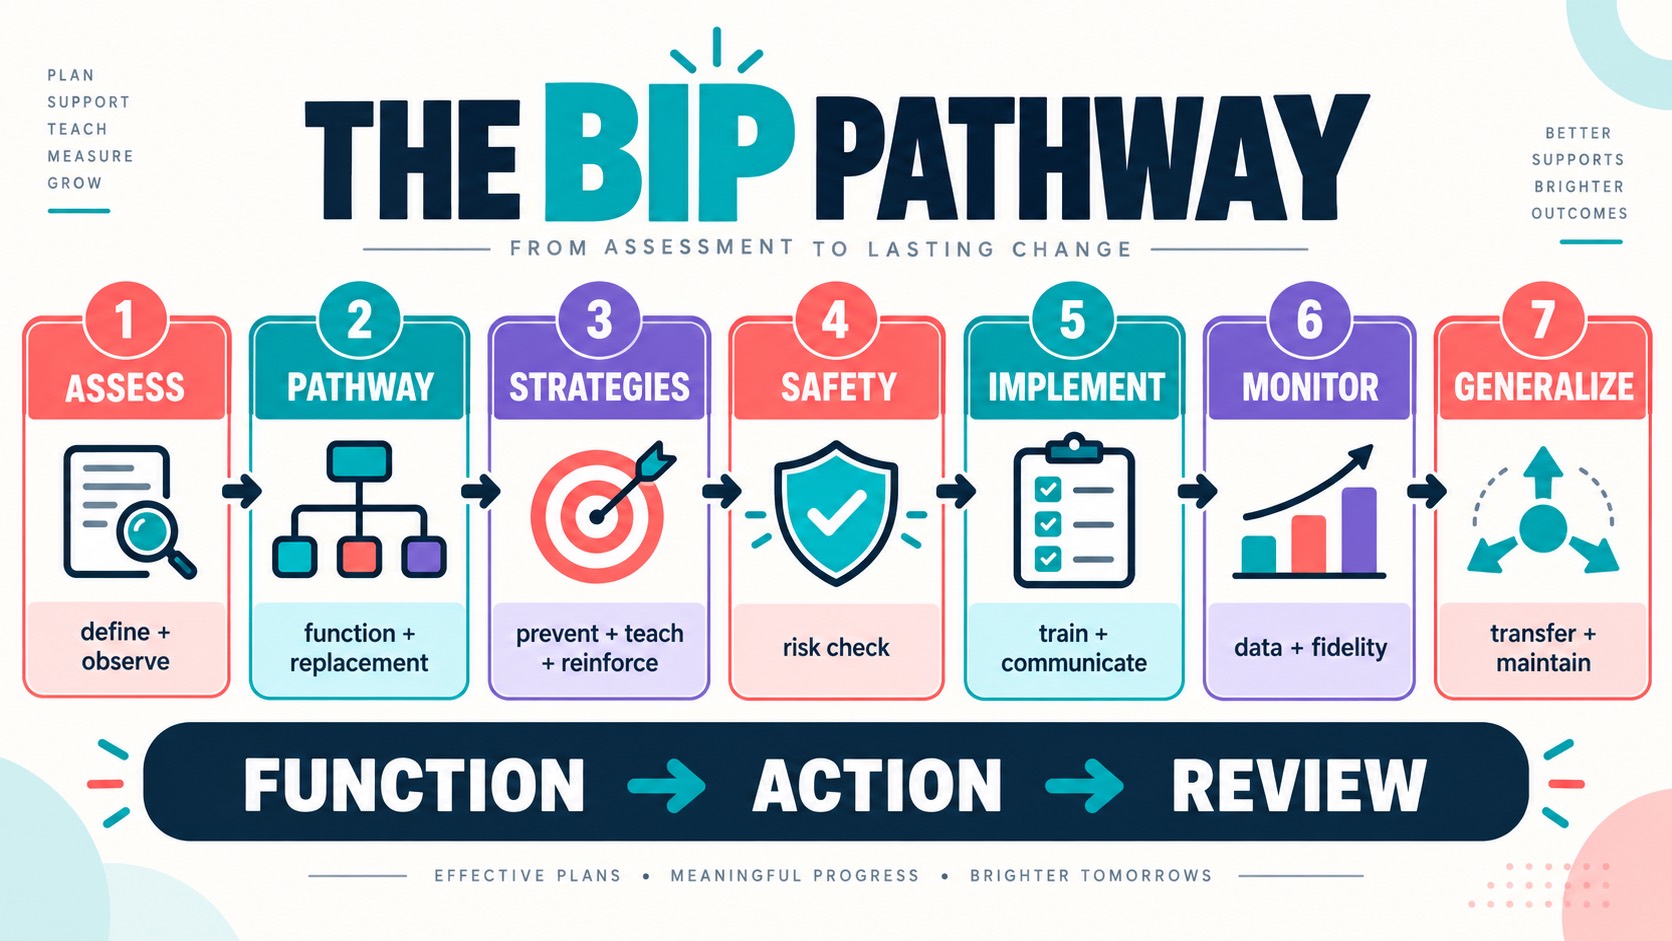
A practical seven-step sequence is consistent with the widely used Tier 3 planning logic in the Missouri Schoolwide Positive Behavior Support development flow chart. The labels can vary by organization, but the reasoning should remain connected.
- Build the competing behavior pathway. Transfer the assessment summary into a pathway that identifies the context, antecedent, problem response, maintaining consequence, desired long-term replacement, and an efficient short-term alternative. The replacement must be realistic for the learner and able to contact the relevant outcome.
- Select function-based strategies. Choose setting-event, antecedent, teaching, and consequence strategies that address the pathway. Prevention should make the problem behavior less relevant, teaching should make the alternative response usable, and reinforcement should make the appropriate response effective.
- Plan how reinforcement and response procedures will work. Specify what happens after the replacement response and how staff respond to the problem behavior without accidentally strengthening it. Avoid vague instructions such as “ignore” or “reinforce good behavior” when the team needs observable steps.
- Decide whether a safety plan is needed. If the behavior creates a serious risk of injury or another urgent concern, the team needs an individualized safety response within the applicable policy. Safety procedures should not be improvised from a generic flow chart.
- Build the implementation plan. Name who will do what, when and where the plan applies, what materials are needed, how staff will be trained, and how questions or deviations are communicated. A technically elegant plan that no one can implement is not a functional intervention.
- Define monitoring and evaluation. Select measures that match the target and replacement behaviors, define the observation conditions, identify who reviews the graph, and set a decision rule. Include implementation fidelity when a weak outcome could reflect incomplete delivery.
- Plan generalization and maintenance. Identify where the response should transfer, which people or materials will change, how reinforcement will be thinned or varied when appropriate, and what evidence supports fading. Generalization is planned; it is not assumed because a skill appeared in one session.
Notice the order: the flow chart does not begin by selecting a consequence from a menu. It begins by connecting assessment to a functionally relevant pathway. It also does not end when the document is signed. Implementation and review are part of the plan’s design.
Which decision points change the flow?
Decision diamonds are useful when the answer determines the next branch. Keep the questions concrete enough that a team can tell what evidence is missing. For exam practice, ask what the learner’s behavior and the data actually support before choosing an intervention.
- Is the definition observable and measurable? If two observers could record different events, return to the definition before interpreting baseline or progress.
- Is the functional hypothesis supported? If the evidence is weak or contradictory, gather more information or consult an appropriately qualified professional rather than treating a guess as fact.
- Does the replacement match the function? A replacement that cannot produce the relevant outcome may be too effortful, too slow, unavailable in the moment, or functionally mismatched.
- Is the plan feasible and safe? If staff cannot complete the required steps or the risk changes, the plan needs redesign, training, consultation, or a safety branch.
- Is the data pattern interpretable? Check the measure, observation period, missing values, context, and fidelity before concluding that the intervention worked or failed.
The flow chart should also show a “stop and verify” branch. When the team lacks necessary information, the right next step may be more assessment, observer training, a fidelity check, or supervision—not a more intense intervention. That distinction is especially important when an answer choice tries to skip from a broad label directly to punishment.
What does a BIP flow-chart example look like?
The table below is a study example, not a client-specific prescription. It demonstrates how a flow chart can connect each stage to a question and an evidence check. The Vanderbilt IRIS BIP framework similarly connects assessment, function, replacement behavior, intervention, and progress monitoring.
| Stage | Decision question | Evidence to check | If the answer is not ready |
|---|---|---|---|
| Assessment summary | Do we know what response and context are being addressed? | Operational definition, examples, nonexamples, baseline, and observation conditions | Clarify the definition or gather more representative observations. |
| Competing pathway | Does the proposed replacement access the relevant function? | Antecedent, problem response, maintaining consequence, response effort, and learner repertoire | Revisit the hypothesis, skill prerequisites, or response efficiency. |
| Intervention design | Do prevention, teaching, reinforcement, and response steps fit together? | Function match, prompt plan, reinforcement criteria, and feasible staff actions | Simplify, train, consult, or redesign before implementation. |
| Implementation | Can the team deliver the plan consistently and safely? | Training, materials, schedule, communication, safety branch, and fidelity checklist | Pause, provide support, or modify the implementation plan. |
| Review loop | What does the comparable data pattern support next? | Target and replacement data, level, trend, variability, fidelity, context, and stakeholder input | Verify the measurement and implementation before changing the plan. |
How should the team monitor and revise the plan?
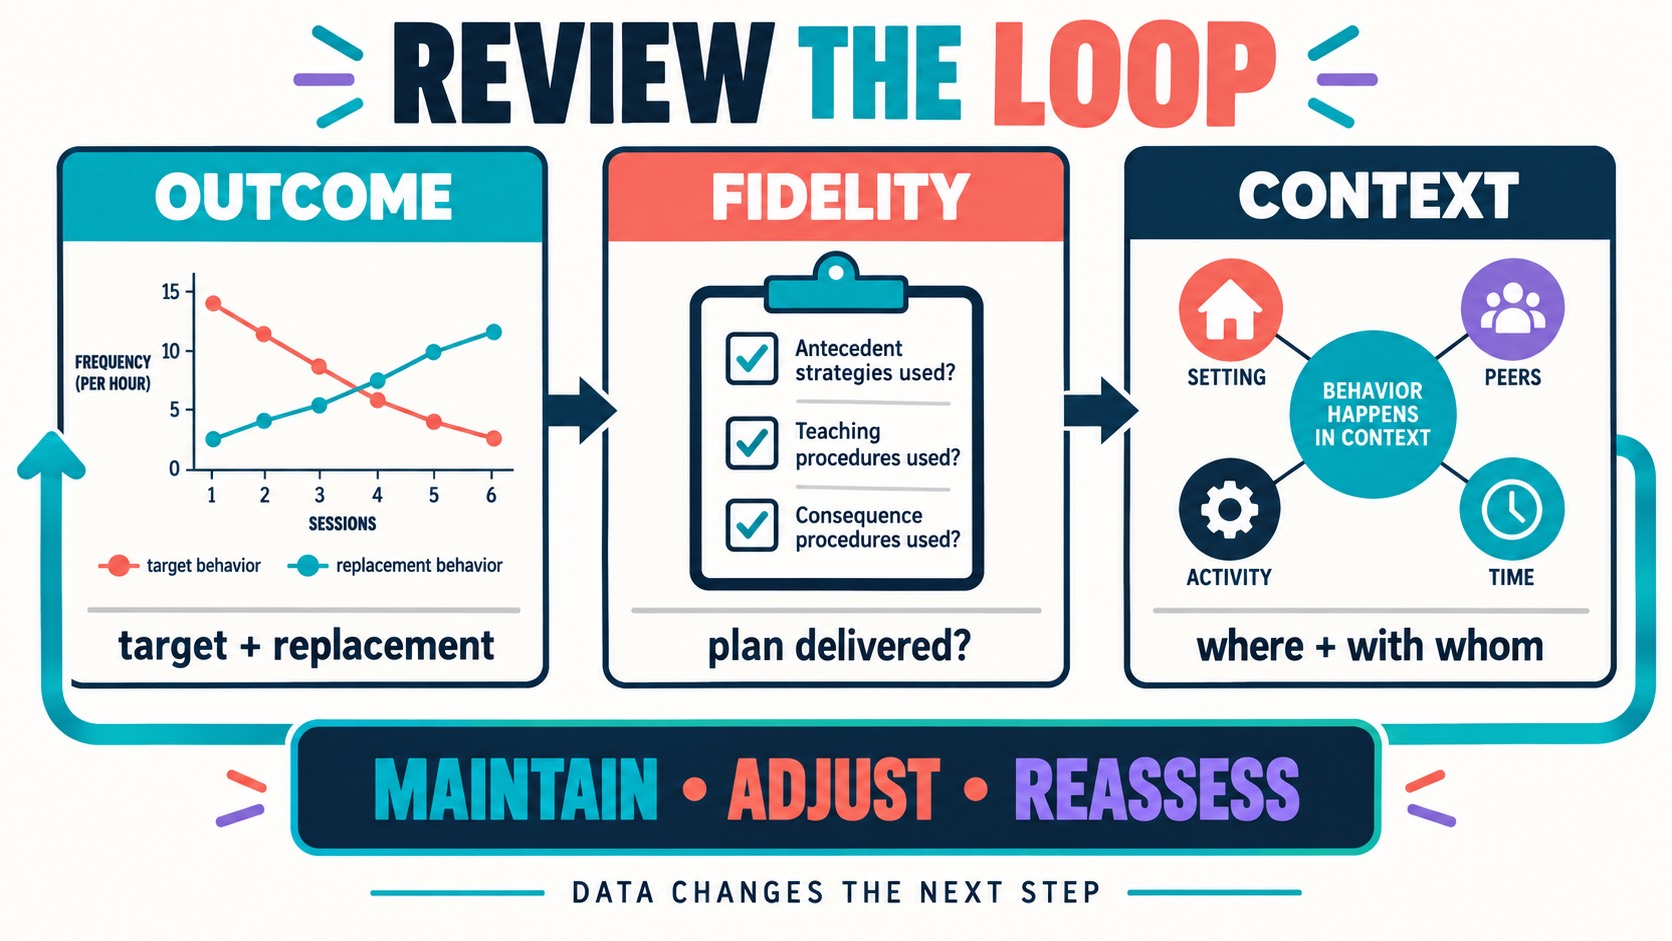
Monitoring turns the flow chart into a feedback system. Decide in advance what will be measured, how often it will be reviewed, and what pattern will trigger a bounded action. The goal is not to change the plan after every observation. The goal is to make a defensible decision using comparable data and the context in which the intervention occurred.
- Check data quality: confirm the definition, scoring rules, denominator, session length, missing values, and any change in observer or setting.
- Display the pattern: graph or summarize target behavior and replacement behavior so level, trend, variability, and phase changes are visible.
- Check implementation fidelity: if the outcome is weak, determine whether the plan was delivered as designed before concluding that the intervention is ineffective.
- Compare across contexts: inspect whether the skill appears with different people, materials, tasks, or settings, and identify what still needs teaching or programming.
- Choose one next action: maintain, adjust one component, collect more information, provide training, consult, reassess, or plan a carefully monitored fade.
The site’s broader behavior intervention plan BCBA guide covers the larger plan concept, while this page focuses on the visual process and its branch points. For the separate measurement layer, see the site’s behavior intervention plan data collection overview. Keeping those intents distinct helps each page answer a more specific question instead of competing with a broad BIP canonical.
What are common BCBA exam traps?
- Starting with a consequence: the chart should connect assessment and function to prevention, teaching, reinforcement, and response—not choose punishment because the behavior is severe or inconvenient.
- Treating a flow chart as a finished plan: the visual sequence does not supply an operational definition, individualized procedure, staff training, or safety details.
- Skipping functional assessment: a label such as “attention seeking” is not enough to justify a function-based intervention.
- Choosing a replacement that is inefficient: a response is not functionally equivalent just because it looks appropriate; it must be usable and produce the relevant outcome.
- Confusing descriptive data with proof: an observed consequence may be correlated with a behavior without establishing its causal function.
- Ignoring implementation fidelity: weak progress may reflect incomplete training or inconsistent delivery, not necessarily an ineffective intervention.
- Assuming generalization: success in one room, with one adult, or with one material does not prove maintenance or transfer.
- Changing many components at once: when possible, a bounded change makes the next review more interpretable and reduces unnecessary disruption.
Quick review: Define the response, connect the assessment to a competing behavior pathway, choose function-matched strategies, add a safety branch when needed, specify implementation and measurement, check fidelity, and use the review loop to decide what happens next. For scenario practice on assessment, intervention, and data-based decisions, try the free BCBA mock exam. It is a study resource and does not claim to reproduce official BACB questions.
Behavior intervention plan flow chart FAQ
Is a BIP flow chart the same as a behavior intervention plan? No. A flow chart organizes the process and decision points. A BIP is an individualized document with definitions, procedures, responsibilities, measurement, training, safety boundaries when needed, and review criteria.
Does every BIP follow exactly seven steps? No. Seven steps are a useful study structure drawn from common function-based planning workflows, but organizations may name, combine, or separate steps differently. The functional logic and current setting requirements matter more than the number seven.
Where does an FBA fit in the flow chart? Assessment information should precede the function-based design branch. The team should use an appropriate assessment process to define the behavior, understand context, and develop or evaluate a functional hypothesis before selecting individualized strategies.
When should a safety plan appear? When the behavior presents a meaningful safety risk or the applicable policy requires an individualized safety response. It should be designed by qualified people within the relevant setting and should not be improvised from a generic online chart.
What should happen when the plan is not working? Check the definition, measurement, context, replacement behavior, implementation fidelity, and functional fit. Then choose a bounded next step such as training, more assessment, a targeted adjustment, consultation, or a carefully monitored revision.
Take the Free BCBA Mock Exam
When you are ready to apply the idea, use the free practice resource below for additional feedback. Take the Free BCBA Mock Exam



