
If you are searching for BCBA demographics, you probably want more than a single percentage. You may be asking how many BCBAs exist, where they are located, what demographic charts actually represent, or whether workforce growth means more access to services. Those questions use related but different datasets. The safest interpretation starts by naming the source, date, population, and denominator before drawing a conclusion.
Table of Contents
- What Do BCBA Demographics Include?
- Which Sources Answer Different BCBA Demographics Questions?
- What Does the Current BACB Snapshot Tell You?
- How Should You Read a BCBA Demographic Chart?
- What Can Region-Specific BCBA Data Show?
- How Do Annual Trends Relate to BCBA Demographics?
- Common BCBA Demographics Interpretation Mistakes
- A Practical BCBA Demographics Research Workflow
- BCBA Demographics FAQ
- Take the Free BCBA Mock Exam
This guide explains how to read the public Behavior Analyst Certification Board (BACB) data without treating a snapshot as a census or a job-posting trend as a certification count. It is useful for BCBA candidates, employers, researchers, and people comparing service availability. Numbers change, charts are revised, and a current official source should control any decision that affects an application, hiring plan, or public claim.
What Do BCBA Demographics Include?
BCBA demographics can refer to several kinds of information about people who hold or pursue a BCBA credential: reported characteristics, geographic distribution, certification level, years or dates of certification, and the size or growth of the certificant population. It can also be used loosely for the workforce around BCBAs, such as job postings or employer demand. Those categories should not be merged automatically. The BACB’s public data pages separate at least four useful questions:
- How many certificants are there? Use a dated total or annual report.
- What characteristics are reported? Use the demographic charts and read their update date and definitions.
- Where are certificants located? Use region-specific data or the Registry’s geographic tools.
- How strong is employer demand? Use an employment-demand report, knowing that job postings are not unique people or guaranteed jobs.
The word “demographics” does not make a dataset more precise. A responsible article or presentation should say whether it describes all people in a source population, only people who reported information, candidates tested during a period, active certificants, or advertisements collected from employers.
Which Sources Answer Different BCBA Demographics Questions?
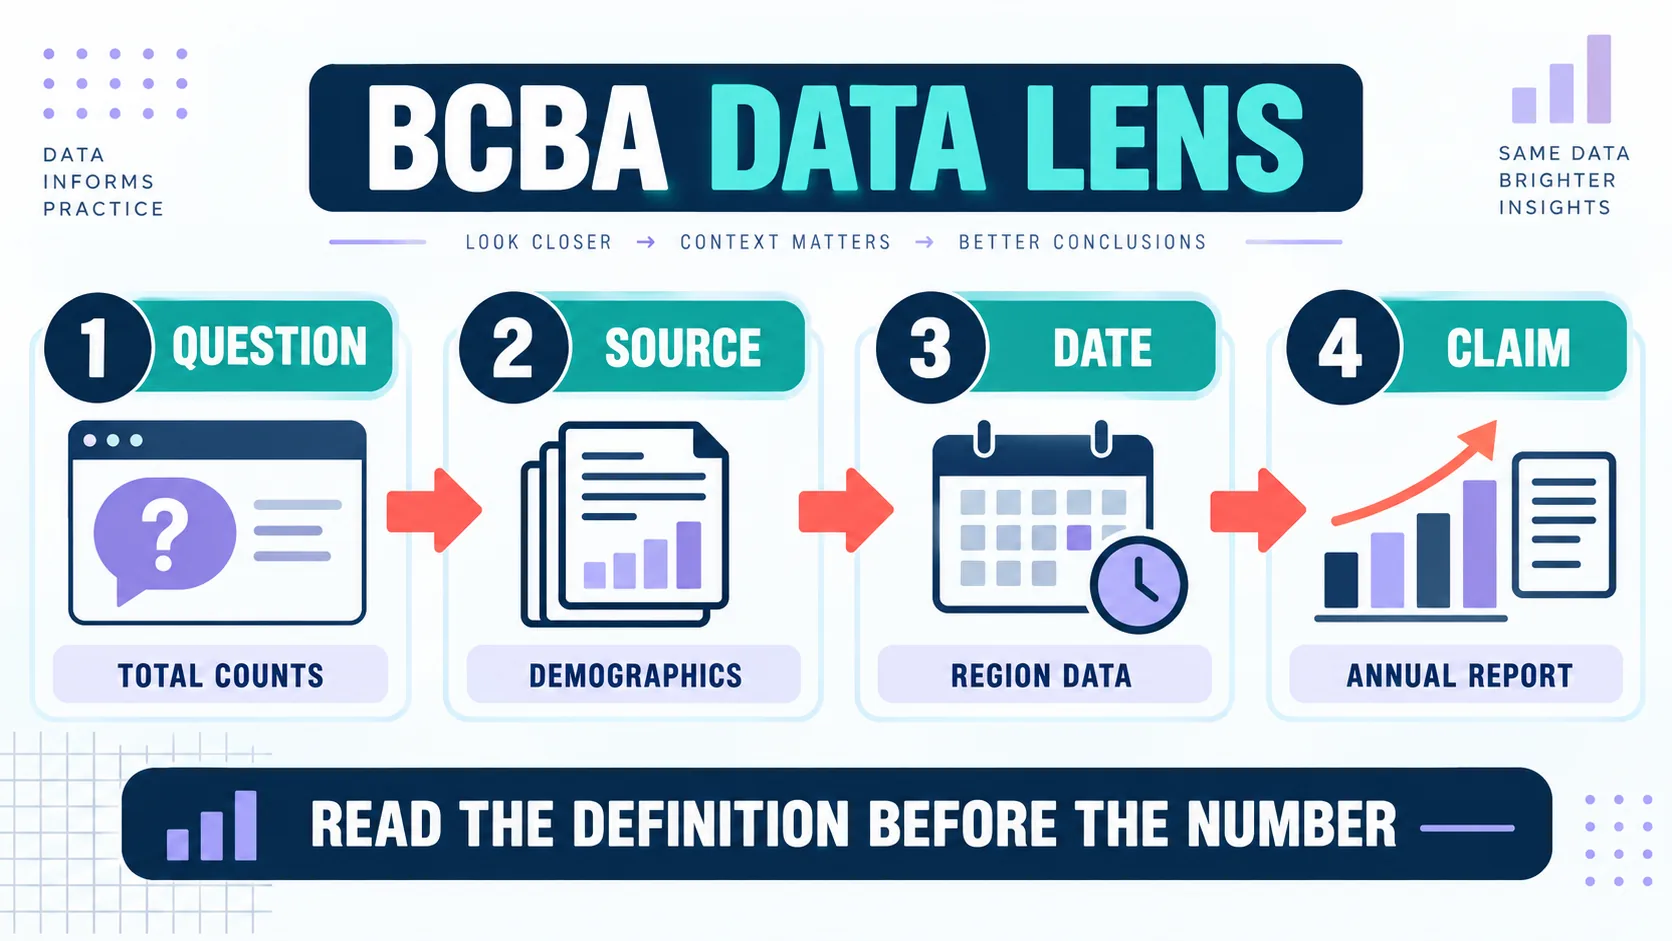
The best starting point is the official BACB Certificant Data page. It currently reports a dated snapshot and separates overall certificant totals from demographic charts and region access. The page states that, as of July 1, 2026, the counts were 85,587 BCBA certificants, 5,246 BCaBA certificants, and 260,174 RBT certificants. Those figures answer a “how many were held on this date?” question; they do not describe every demographic variable or predict future supply.
The BACB Annual Data Report serves a different purpose. Its 2025 report lists end-of-year totals, testing activity, first-time and retake pass rates, and newly certified individuals. The end-of-2025 BCBA total shown there is 81,566. It should not be added to the July 1 snapshot or treated as a contradiction without checking the date, status definition, and reporting method.
For geography, use the BACB’s region-specific data tool. It can support questions about state or regional distribution, but a high count of certificants does not automatically prove that a location has enough providers for every client. Service need also depends on population, payer access, licensure, language, travel distance, caseload, and whether a certificant is currently practicing in that area.
For employer demand, the BACB’s 2026 employment-demand report uses job-posting data. It reports 132,307 U.S. postings in 2025 that required or preferred BCBA or BCBA-D certification, and describes a 28% increase from 2024 to 2025. That is a labor-market signal collected from postings; it is not a count of unique employers, unique vacancies, active BCBAs, or filled positions.
What Does the Current BACB Snapshot Tell You?
A dated snapshot is useful for scale. It can help a reader understand the relative size of the BCBA, BCaBA, and RBT credential populations and see that the field has grown. It becomes misleading when a writer removes the date or compares it directly with an end-of-year total as though both were measured at the same moment.
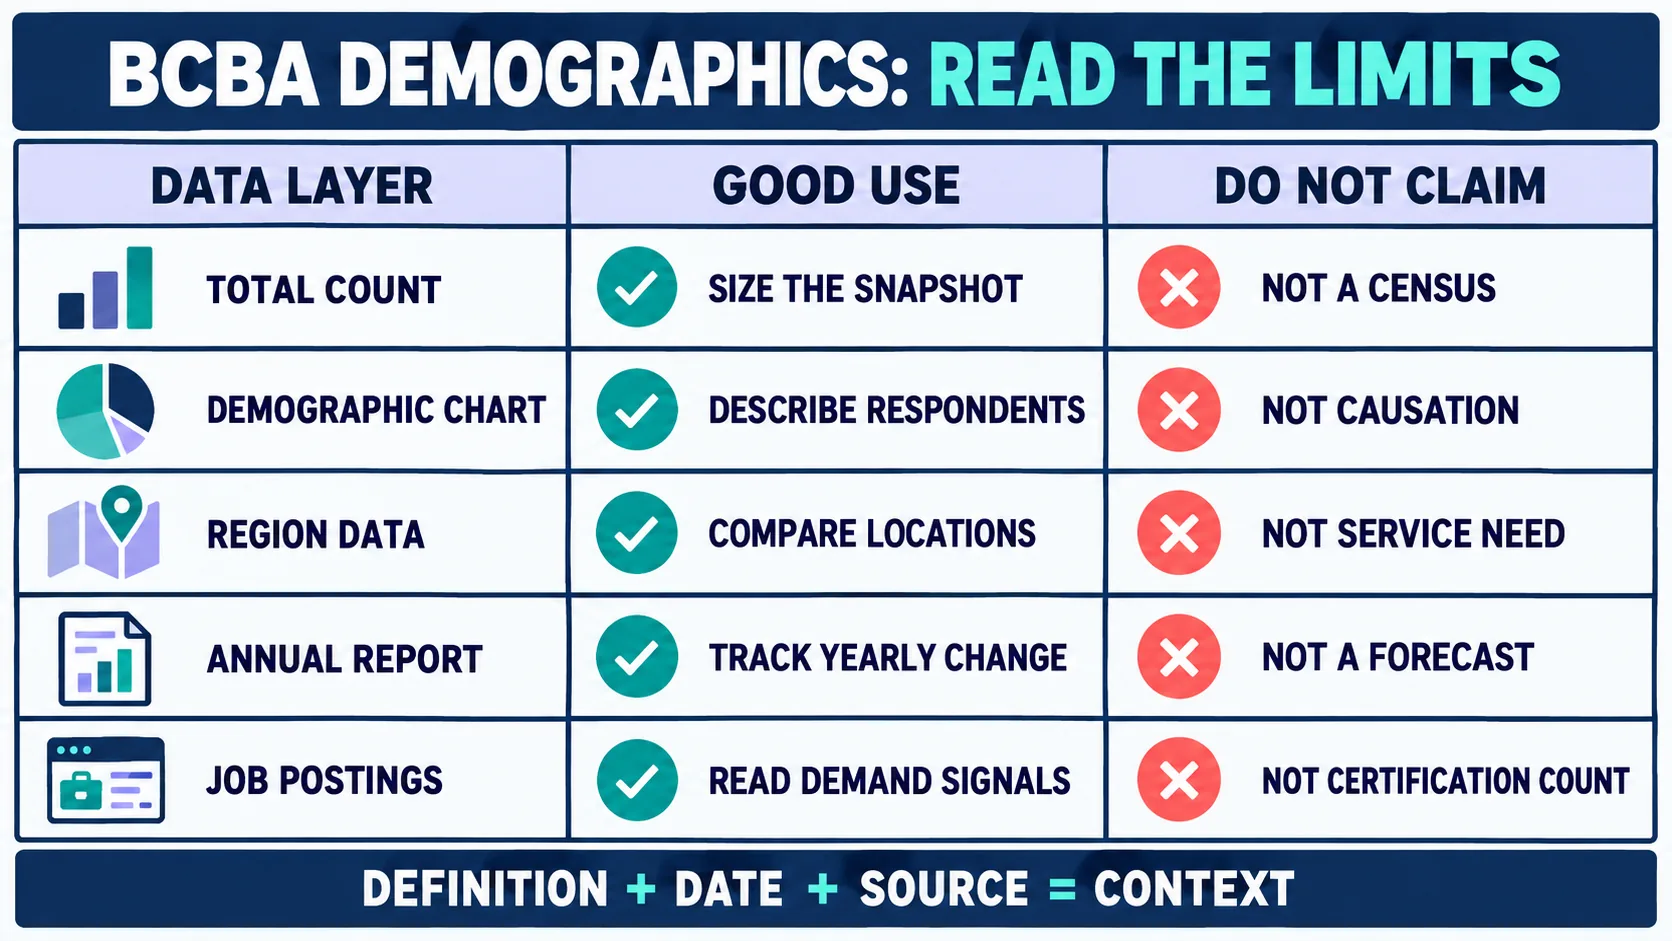
| Data layer | Good use | Do not claim |
|---|---|---|
| Dated certificant count | Size the credential snapshot on the stated date | It is a census of people currently delivering services |
| Demographic chart | Describe what respondents reported in the chart’s population | A demographic pattern caused a clinical or economic outcome |
| Regional data | Compare counts or distributions by location | A high count equals local service access or unmet need |
| Annual report | Track testing, new certifications, and end-of-year totals | It is interchangeable with a midyear snapshot |
| Job postings | Read an employer-demand signal | It is a count of unique people or guaranteed jobs |
When you quote a number, write the date directly beside it. If you compare two numbers, write the definition beside both. That one habit prevents a common error: turning “certificants at a snapshot” into “active providers available to families.” The latter requires additional evidence.
How Should You Read a BCBA Demographic Chart?
The BACB Certificant Data page says its demographic images depict information reported by certificants in their BACB accounts and were last updated on January 8, 2026. That wording matters. A chart based on account reporting is not automatically a random sample of every person who holds a credential, and a chart’s denominator may differ from the total number of certificants shown elsewhere on the page. Use a four-part reading method:
- Read the title and definition: identify whether the chart concerns BCBA, BCBA-D, BCaBA, RBT, or a combined group, and note how the category is defined.
- Find the date: record the chart update date and the period represented by the data. A page update date is not always the same as the date people answered a question.
- Check the denominator: ask whether the percentages use all certificants, respondents, a credential subgroup, or another filtered population.
- State the limitation: explain what the chart can describe and what it cannot establish, especially when discussing causation, access, quality, or outcomes.
Demographic categories also require respectful wording. Prefer “people reported” or “the chart shows” when describing self-reported information. Avoid converting an aggregate category into an assumption about an individual BCBA’s competence, specialty, values, or clinical approach. The purpose of demographic data is to describe a population and improve questions, not to stereotype a professional or client.
What Can Region-Specific BCBA Data Show?
Regional data can help an employer map the credential population or help a researcher compare where certificants are located. It can also identify places worth investigating further. It cannot, by itself, answer whether a family can obtain timely, culturally responsive, affordable services. Before using a state or regional count in a business or access claim, check:
- Whether the count includes BCBA-D, BCBA, BCaBA, or RBT records.
- Whether the status filter includes active, expired, or inactive certifications.
- Whether the location is a mailing address, a practice location, or a self-reported region.
- Whether the data are current enough for a time-sensitive decision.
- Whether state licensure, payer enrollment, and employer capacity reduce the usable provider pool.
A location with more certificants may have a larger population, more training programs, stronger employer demand, or better reporting. A location with fewer certificants may be rural, newly developing, or measured through a different operational definition. Treat the geographic count as a starting signal, then pair it with state-board information, payer directories, job data, wait-time evidence, and local stakeholder interviews.
How Do Annual Trends Relate to BCBA Demographics?
Annual reports help separate several events that are often collapsed into the word “growth”: people taking an exam, people passing for the first time, people passing on a retake, newly certified individuals, and the total number of certificants at year-end. These measures answer different questions and have different denominators.
Employment-demand reports add another layer. Job postings can rise because employers are expanding, because organizations repost hard-to-fill positions, because the data source has improved, or because one role is advertised across several channels. A rise in postings may be important, but it does not prove that the number of people entering the field, leaving the field, or serving clients has changed by the same percentage.
- Use annual certification data to describe credentialing activity.
- Use the certificant snapshot to describe a dated population size.
- Use demographic charts to describe reported characteristics and their stated denominator.
- Use regional data to compare locations, then verify the local practice context.
- Use job postings to discuss demand signals, not provider supply or service quality.
Common BCBA Demographics Interpretation Mistakes
The most common mistake is quoting a percentage without its source date. The second is comparing a live regional tool with a historical annual report without saying that the measurement windows differ. The third is treating a credential as proof that a person is currently taking clients. The fourth is using workforce demand as a forecast of salaries, access, or exam success.
- False precision: a rounded chart estimate is presented as an exact current count.
- Denominator drift: a respondent percentage is described as if it represents all certificants.
- Category collapse: BCBA, BCBA-D, BCaBA, and RBT counts are merged without explanation.
- Geographic overreach: a credential location is treated as a service location.
- Causal language: a descriptive demographic difference is presented as the reason for an outcome.
- Date mixing: a July snapshot, an end-of-year total, and a 2025 job report are presented as one synchronized dataset.
If a conclusion matters, preserve a small audit trail: save the source URL, access date, chart or table name, date shown by the source, filter settings, and the exact sentence you are supporting. That practice makes it easier to update an article when BACB data change and easier for a reader to reproduce the comparison.
A Practical BCBA Demographics Research Workflow
Use this sequence before writing a report, planning recruitment, or making a public claim:
- Write the question first: are you asking about population size, characteristics, geography, credentialing activity, or employer demand?
- Select the matching source: start with the BACB page that measures that question rather than the first chart that looks relevant.
- Record the date and denominator: copy the definitions and filters into your notes before calculating anything.
- Separate description from explanation: state what the data show, then identify what additional evidence would be needed to explain it.
- Test the claim locally: pair a national or regional snapshot with licensing, payer, hiring, and service-access evidence when the decision is local.
- Schedule a refresh: data pages and policy definitions change; add a review date to the article or dashboard.
This workflow is also useful for BCBA exam preparation. A question may include a graph, a data table, or a demographic description to test whether you can identify the population, variable, measurement window, and warranted conclusion. The correct answer usually respects the evidence boundary instead of adding a causal story that the display cannot support.
BCBA Demographics FAQ
Are BCBA demographics the same as the number of BCBAs?: No. A total count describes how many people meet a particular source definition at a stated time. Demographics describe characteristics or distributions within a defined population. The two can appear on the same official page but should not be treated as the same measurement.
How current are BACB demographic charts?: The BACB Certificant Data page currently states that its demographic images were last updated on January 8, 2026. Check the live page before publishing, because update dates and definitions can change.
Do BCBA demographic data prove service availability?: No. Credential counts are only one input. Service access also depends on active practice, state licensure, payer participation, staffing capacity, language, travel, waitlists, and the type of care a client needs.
Can I use job-posting data as a BCBA workforce count?: No. Job postings are a demand signal. They may include duplicate or repeated advertisements, and they do not tell you how many people filled the role, how many employers posted it, or whether a certificant is available in a specific community.
After you have identified the data boundary, keep your exam preparation equally evidence-based. Our BCBA demographics practice questions can help you read scenarios and displays without adding assumptions that the question never gave you. A careful source, date, and denominator check is the difference between a useful BCBA demographics summary and a number that sounds precise but cannot support the claim.
Take the Free BCBA Mock Exam
If you want a low-pressure way to check your recall, use the free practice resource below. Take the Free BCBA Mock Exam



