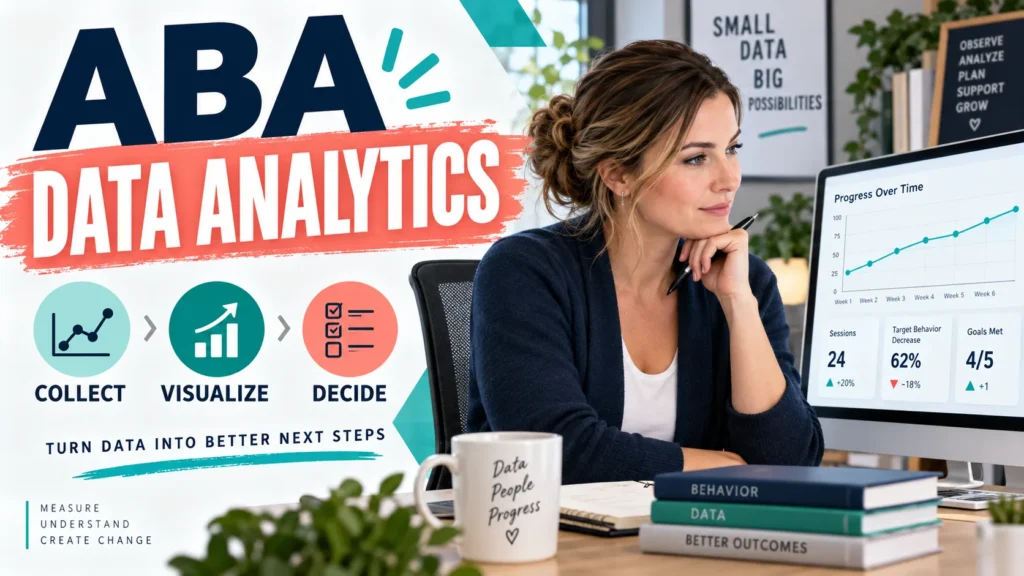
A practical BCBA guide to turning clean session data into visual patterns, defensible decisions, and the next measurable action. If you searched for ABA data analytics, you may be looking for more than a dashboard or a data-collection app. In applied behavior analysis, analytics is the reasoning loop that connects an operational definition to a measurement system, a graph, a pattern review, and a decision. The technology can make that loop faster, but it does not make the clinical decision for you.
Table of Contents
- What ABA Data Analytics Means
- The Four-Step ABA Data Analytics Loop
- How to Read an ABA Dashboard
- A Fictional Example: From Pattern to Next Step
- Data Quality and Privacy Checks
- Analytics, Software, and AI Are Not the Same Thing
- Turn Analytics Into BCBA Practice
- Frequently Asked Questions
- Take the Free BCBA Mock Exam
This guide explains the loop in plain language: collect, visualize, analyze, and decide. It also shows how to read level, trend, and variability, how to check data quality before changing an intervention, and how to keep a dashboard from becoming a substitute for professional judgment. Use fictional examples for study; real client information must be handled within your role, privacy obligations, and secure systems.
Scope note: This is an educational BCBA/ABA study guide, not medical, legal, privacy, or clinical advice for a specific client. A qualified behavior analyst must interpret actual case data within the client’s plan, consent, supervision, and applicable rules.
What ABA Data Analytics Means
In ABA, data analytics means using organized behavioral data to answer a defined question and choose the next action. The question might be: “Is independent responding increasing across sessions?” “Did problem behavior change after the intervention?” “Is the apparent improvement stable across staff and settings?” or “Do we need to check treatment integrity before revising the plan?”
That is different from simply collecting more numbers. Data become useful when the behavior is defined clearly, the measurement matches the question, the conditions are recorded, and the team has a decision rule. A spreadsheet full of percentages can still produce a poor decision if different staff measure different responses or if the graph hides a change in setting. A helpful mental model is:
- Data collection records what happened.
- Visualization makes patterns easier to inspect.
- Analysis describes the pattern and tests whether the evidence is trustworthy enough to act on.
- Decision-making connects the pattern to a documented keep, investigate, or change action.
This approach is consistent with the wider behavior-analytic emphasis on recording, displaying, and analyzing data for decisions. It also creates a useful boundary: analytics can organize evidence, but a graph alone does not establish causality, clinical appropriateness, or a safe treatment change.
The Four-Step ABA Data Analytics Loop
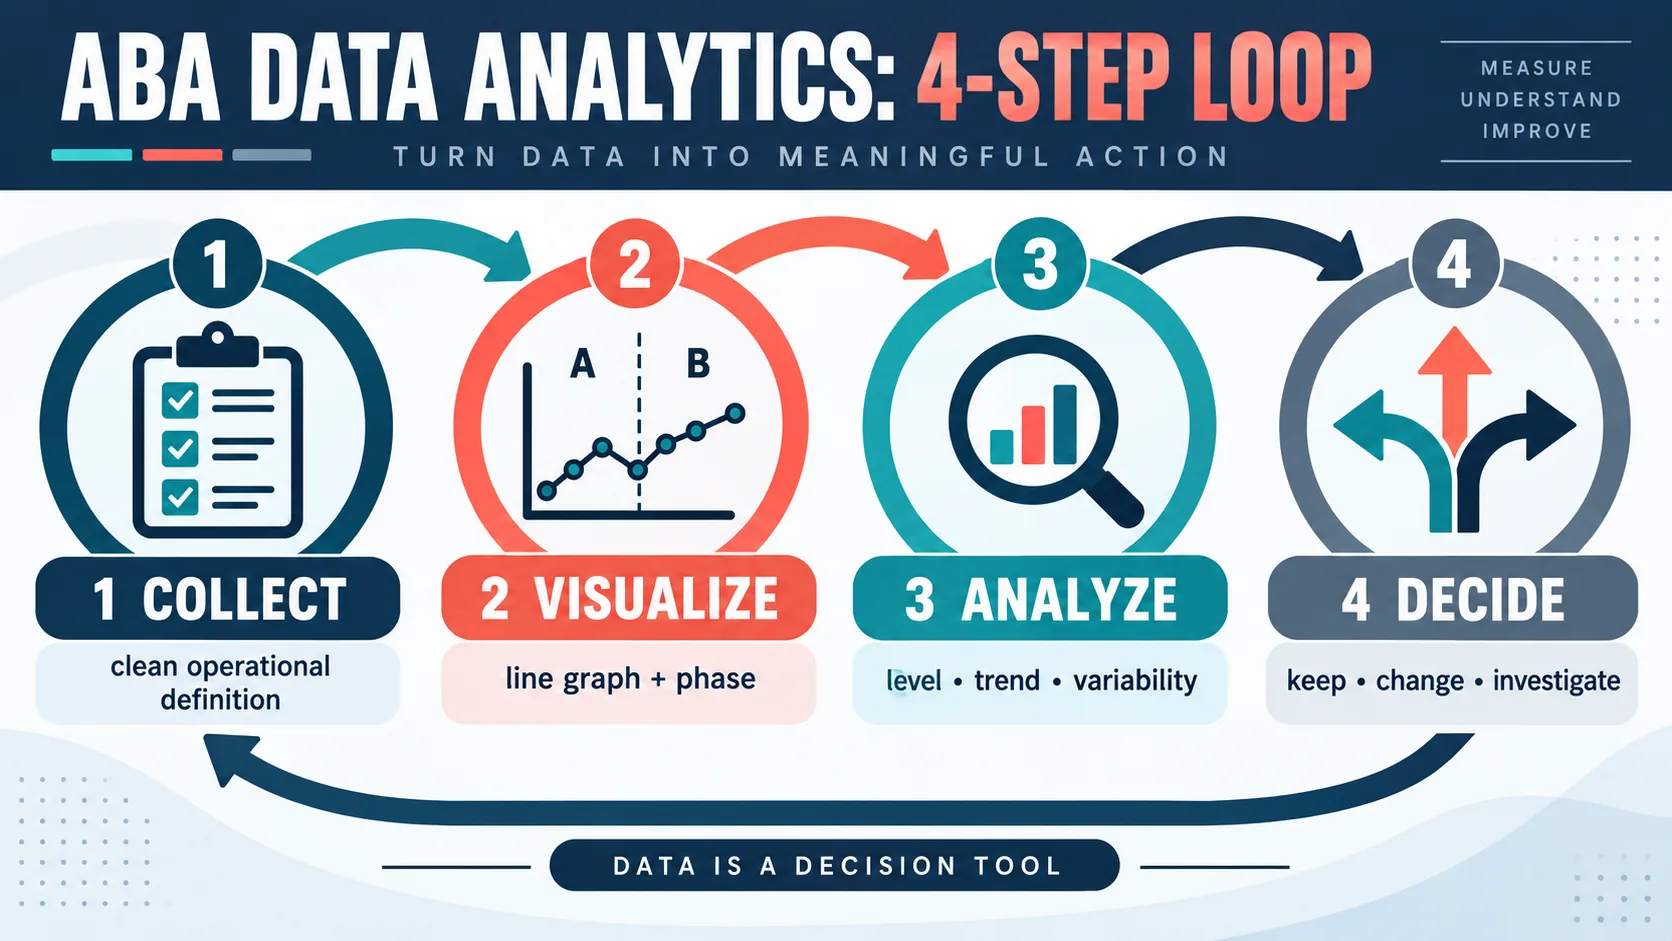
The strongest ABA data analytics workflow is a loop, not a one-time report. After a decision, you collect the next set of data under the revised or continued conditions and inspect the new pattern. Each step should answer a different question.
| Step | Question | Quality check |
|---|---|---|
| 1. Collect | What observable response, in what context, will be measured? | The definition, unit, schedule, and recording rule are consistent across observers. |
| 2. Visualize | What pattern appears across sessions, phases, settings, or people? | The graph identifies dates, phase changes, missing data, and meaningful context. |
| 3. Analyze | What are the level, trend, and variability, and what alternative explanations must be checked? | You inspect data quality, treatment integrity, context, and replication instead of reacting to one point. |
| 4. Decide | Should the team keep the plan, investigate the measurement/context, or change something? | The action is documented, within scope, and tied to a pre-specified or clearly justified rule. |
When studying for the BCBA exam, notice how a question moves between these steps. A prompt may look like a graph question but actually test whether the measurement matches the behavior. Another may show a worsening trend but ask you to check treatment integrity before changing the intervention. Analytics is the bridge between the visible number and the best next action.
How to Read an ABA Dashboard
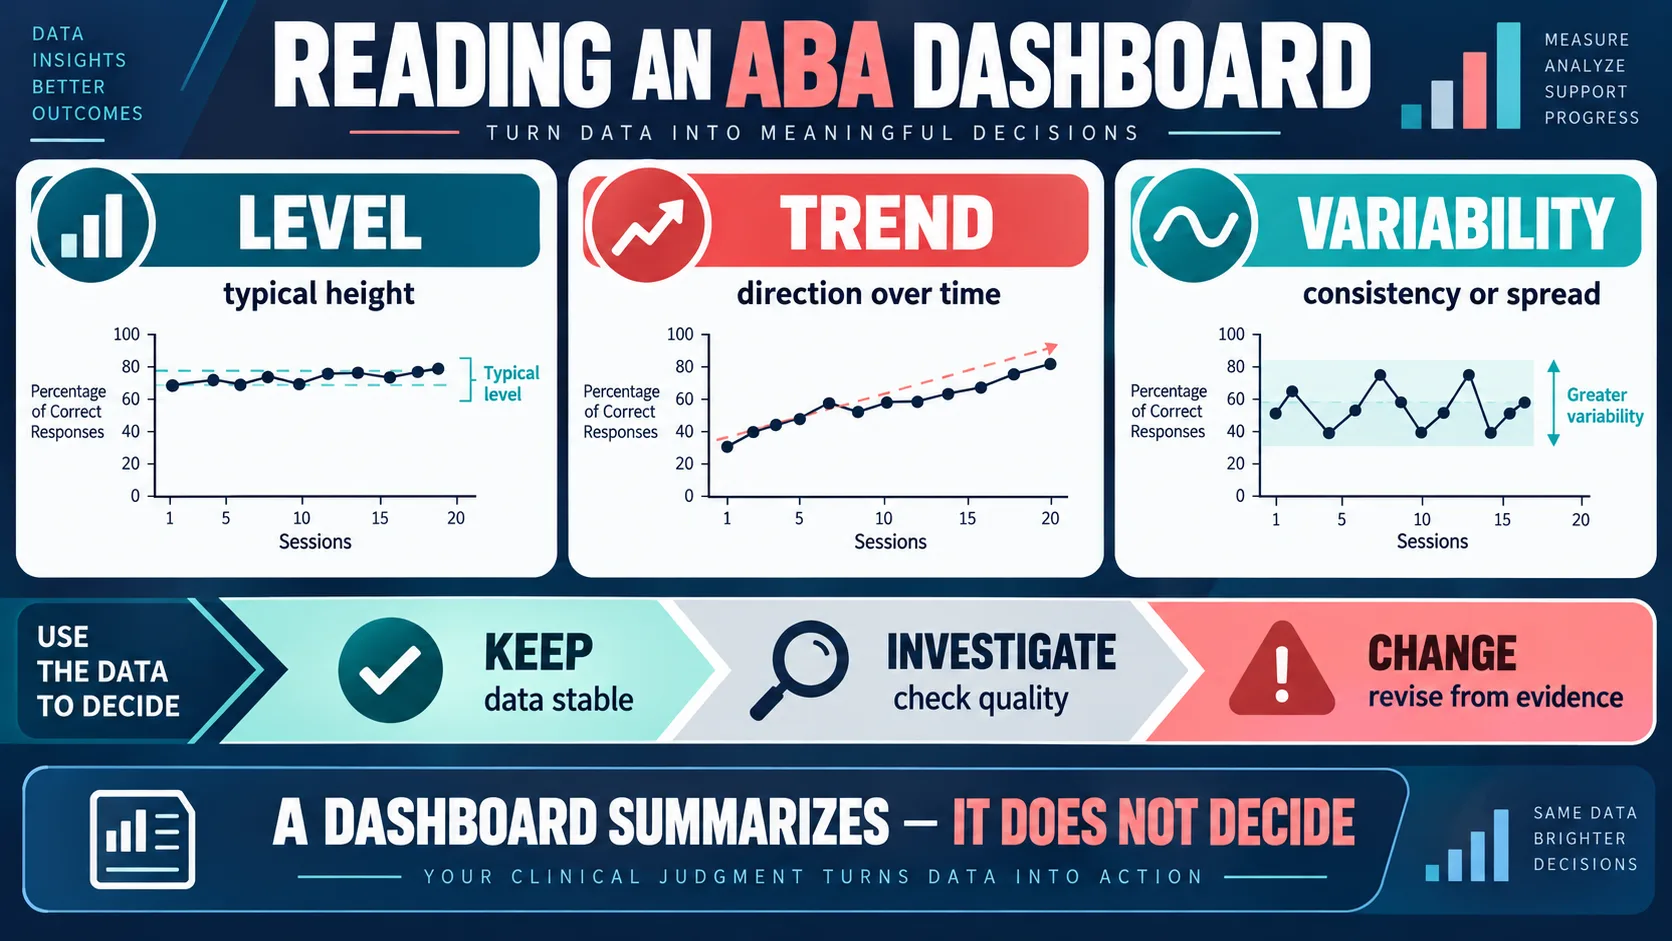
A dashboard can show several measures at once, but the first review should remain disciplined. Start with the target definition and unit. Then read the graph before reading the color-coded summary card. A green arrow may reflect an average that hides high variability, a setting change, or missing sessions.
| Pattern | What it describes | What it does not prove |
|---|---|---|
| Level | The typical height of the data in a phase or comparison period. | A higher or lower level by itself does not identify why the behavior changed. |
| Trend | The general direction of the data over time. | A trend line does not erase outliers, phase changes, or threats to measurement quality. |
| Variability | How consistently the data cluster or spread within and across phases. | A variable pattern is not automatically treatment failure; context and implementation need review. |
Use a simple decision strip after you describe the pattern:
- Keep: The pattern is improving or stable, data quality is acceptable, and the plan remains appropriate.
- Investigate: The pattern is unclear, variable, unexpectedly different across settings, or affected by missing or questionable data.
- Change: The evidence and clinical context support revising a component, teaching step, measurement rule, or implementation support.
Do not make the decision category a rigid algorithm. It is a prompt for disciplined reasoning. For a real client, review the relevant plan, assent and consent requirements, safety considerations, supervision, and team communication before implementing a change.
A Fictional Example: From Pattern to Next Step
Imagine a fictional learner whose independent task initiation is measured as the percentage of opportunities completed within 10 seconds. The team records 10 opportunities per session across three weeks. During baseline, the data range from 30% to 45%. After a teaching package begins, the next six sessions range from 55% to 75%, but the final two sessions drop to 40% and 45%. A weak analysis would say, “The intervention stopped working; change it.” A better analytics review asks:
- Did the operational definition and opportunity count stay the same?
- Were the last two sessions in a new room, with a different task, staff member, prompt level, or schedule?
- Were the opportunities actually presented, or were several trials interrupted?
- Was the teaching package implemented with the planned prompting and reinforcement?
- Does the pattern replicate across another session before a major change is made?
If the last two sessions occurred during a new classroom routine and implementation was incomplete, the immediate decision may be investigate, not “change everything.” If the same drop replicates under consistent conditions, the team can use the data and clinical context to select a narrower revision. The value of analytics is not producing a dramatic conclusion; it is making the next conclusion more defensible.
Data Quality and Privacy Checks
Before trusting an analytics output, check the data-generating process. A visually attractive dashboard can still be wrong. Ask whether:
- The target behavior is observable, measurable, and written the same way for every observer.
- The measurement system matches the behavior and the decision question.
- Dates, phase lines, settings, staff, prompts, and relevant context are recorded.
- Missing data are visible rather than silently treated as zero.
- Observers were trained and agreement or integrity checks were scheduled when appropriate.
- The summary uses the correct denominator, rate, percentage, duration, latency, or interval logic.
- The team knows who can access, export, correct, and retain the information.
Privacy is part of the analytics workflow, not a final checkbox. Use de-identified examples for training and avoid placing unnecessary protected information in a general-purpose dashboard. Review the applicable HHS HIPAA guidance, your organization’s policies, and the client’s authorization before deciding how data may be stored, shared, or exported. Ethical duties and professional scope still apply when a tool makes a report easy to download.
Analytics, Software, and AI Are Not the Same Thing
A data platform may collect session records, graph them, calculate summaries, and display alerts. That is useful infrastructure. Analytics is the reasoning process that determines whether the fields, calculations, graph, and decision rule answer the question. Artificial intelligence may help with sorting or summarizing, but it introduces additional validation, privacy, bias, and human-review questions. When comparing tools, ask:
- Can the system preserve the original observation and show how a summary was calculated?
- Can you separate phases, settings, observers, prompts, and missing data?
- Can a qualified reviewer correct an error without losing the audit trail?
- Does the export support the documentation and review process you actually use?
- What access controls, retention settings, and vendor terms protect the data?
For more focused study, use the existing measurement methods guide for choosing a measure, the ABA graphs guide for visual analysis, and the data platforms comparison for tool-selection questions. This page is the connecting workflow, not a replacement for those more specific resources.
Turn Analytics Into BCBA Practice
To study this topic, practice describing the graph before selecting an answer. State the measurement, phase, level, trend, variability, data-quality concern, and next action. Then ask whether your action is supported by the evidence or merely sounds decisive.
The Free BCBA Mock Exam can be used as a separate practice checkpoint for data interpretation and application. Treat the score as study data: log the reasoning error, review the relevant measurement or graph concept, and test the skill on a fresh scenario. It is not an official BACB result and does not replace supervised clinical judgment.
Frequently Asked Questions
What is ABA data analytics?: ABA data analytics is the process of using organized behavioral data to describe patterns and choose a documented next action. It connects collection, visualization, analysis, and decision-making; it is not limited to a dashboard or software feature.
What are the four steps of data analytics in ABA?: The practical loop is collect, visualize, analyze, and decide. After the decision, collect the next data and repeat. Each step should have a clear question and a quality check.
What should I look for on an ABA graph?: Start with the target definition, unit, dates, and phase changes. Then describe level, trend, and variability. Check missing data, context, treatment integrity, and observer consistency before treating the pattern as evidence for a change.
Does a dashboard make the clinical decision?: No. A dashboard summarizes selected data. A qualified behavior analyst still has to evaluate measurement quality, context, client safety, consent, treatment integrity, and the appropriateness of the next action. Is ABA data analytics the same as data collection?: No. Data collection is one step in the larger loop. Analytics includes the graph, pattern description, quality review, decision rule, documentation, and follow-up.
Bottom line: Good ABA data analytics makes the path from observation to action visible. Define the behavior, collect the right measure, visualize the pattern, inspect level/trend/variability, check data quality, and document whether you will keep, investigate, or change the plan.
Take the Free BCBA Mock Exam
When you are ready to apply the idea, use the free practice resource below for additional feedback. Take the Free BCBA Mock Exam