Multiple Baseline Design
A multiple baseline design is a single subject experiment that allows for the investigation of two or more dependent variables at the same time. The independent variable, the intervention, is used to assess the impacts of three kinds of dependent variables: behaviors, persons, and settings.
To develop a multiple baseline design and experimenter, baseline data on all dependent variables must be collected first. Once each variable has a pretty stable baseline, the intervention for one variable is conducted while the baseline data for the others is obtained. The intervention is undertaken for the second variable if the intervention data for the first variable reveals a trend in the intended direction. This experimental sequence continues until the intervention has been administered to all of the behavior modification program’s dependent variables. A functional relationship is identified if the intervention caused a change to each dependent variable once it was introduced.
Deep-end invariables are separated into three groups by several baseline designs. The first is a multiple baseline across behaviors analysis, which looks at two or more behaviors from a single student. The second is a multiple baseline across persons, in which two or more individuals are tested for a single common behavior. The third is a multiple baseline across settings study, in which a single student’s behavior is studied in two or more situations. A student demonstrating unacceptable actions in a classroom is an example of a multiple baseline across behaviors. If each target behavior is lowered after baseline data is acquired, the intervention is conducted for each dependent variable one at a time.
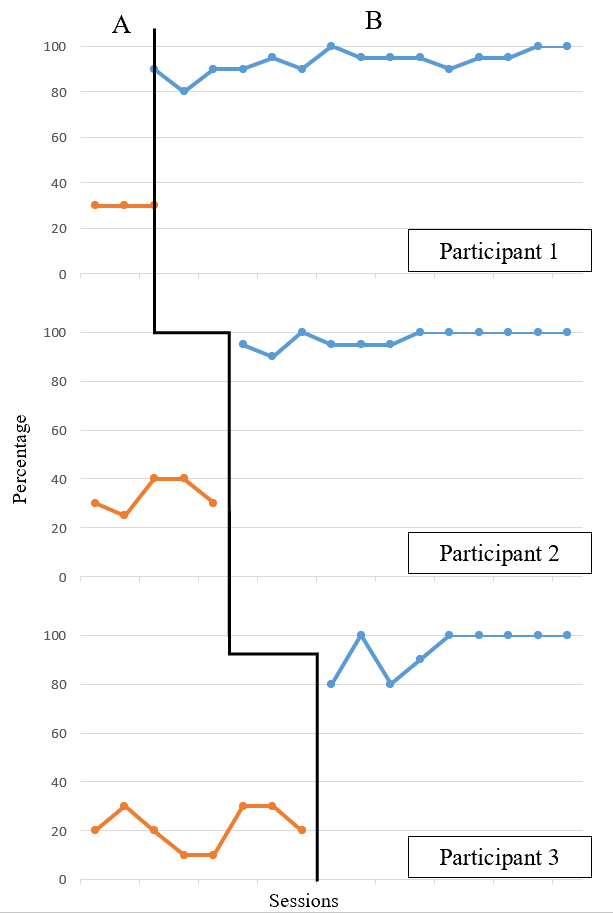
The top portion of this sample graph represents the first behavior to get the intervention, while the bottom portion represents the second. A math instructor who wishes to improve the multiplication abilities of three struggling children as an example of a multiple baseline across persons. Keep in mind that the intervention is implemented one by one for everyone. A functional relationship exists if each student’s multiplication skills improve after receiving the intervention.
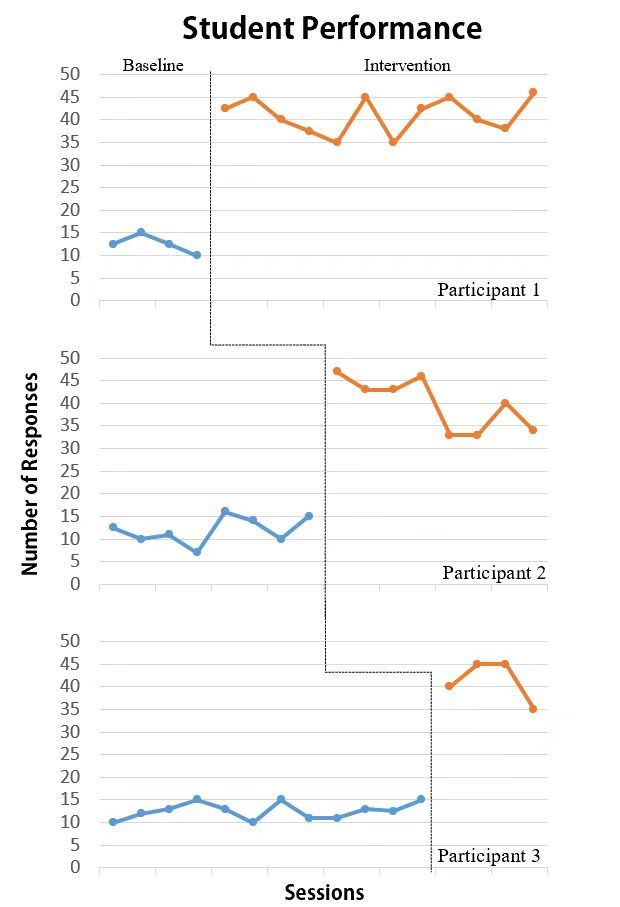
This is an illustration of a graph with multiple baselines among individuals. A kid who uses inappropriate language in math and scientific classrooms is an example of a multiple baseline across settings. Following the collection of baseline data, the intervention is implemented in the math classroom, followed by the science classroom. If the use of inappropriate language in both environments drops after the intervention, there is a functional link.
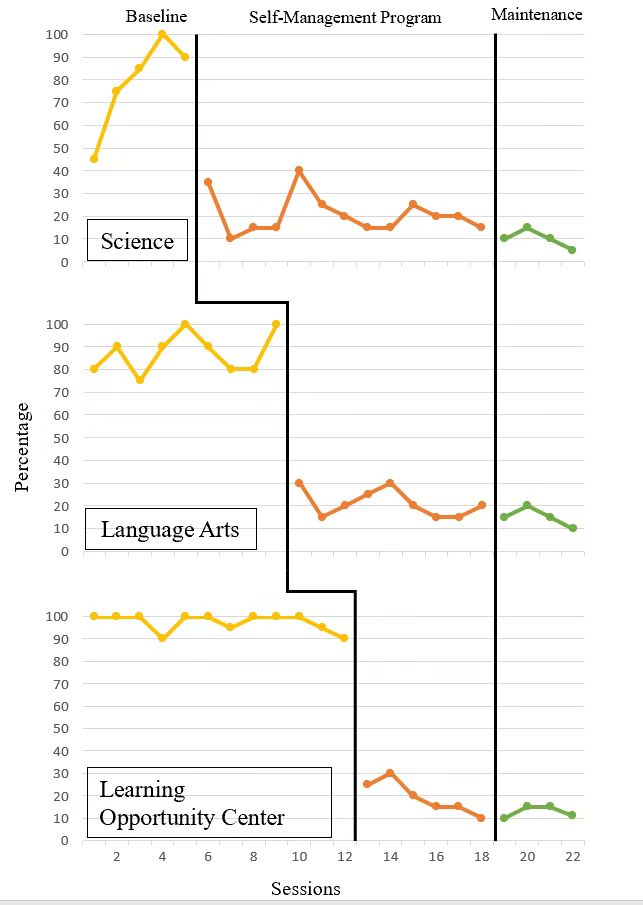
If a functional relationship exists, each setting’s baseline data will stay consistent until the intervention is performed. As seen in the example graph, the trend change should only appear once the particular setting has received the intervention.
Alternating Treatment
Using an alternate treatments design, researchers may compare the effectiveness of two or more intervention options on a single target behavior. On the other hand, the multiple baseline approach, compares the effects of a single intervention on many target behaviors. The ultimate purpose of this approach is to compare which intervention technique is the most successful by assessing its influence on a particular target behavior. A teacher might use an alternating treatments design to examine the impact of two math interventions on a student’s fundamental multiplication abilities.
The first stage in implementing an alternating treatments design is to operationalize the target behavior and choose two or more viable interventions. The target behavior’s baseline data is collected in the second stage. The next stage is to make sure the interventions are correctly alternated. Each intervention should be presented to the learner an equal number of times. To reduce carryover effects, the performed sequence of each intervention should be random and counterbalanced. The interventions themselves can be done in the same session, which implies that from one session to the next, the first intervention would be followed by the second. For example, one treatment in the morning and one in the afternoon. Or on successive days, such as one intervention is on Monday and the second is on Tuesday. Remember that the interventions must be randomized and administered an equal number of times for an equal length, regardless of the arrangement.
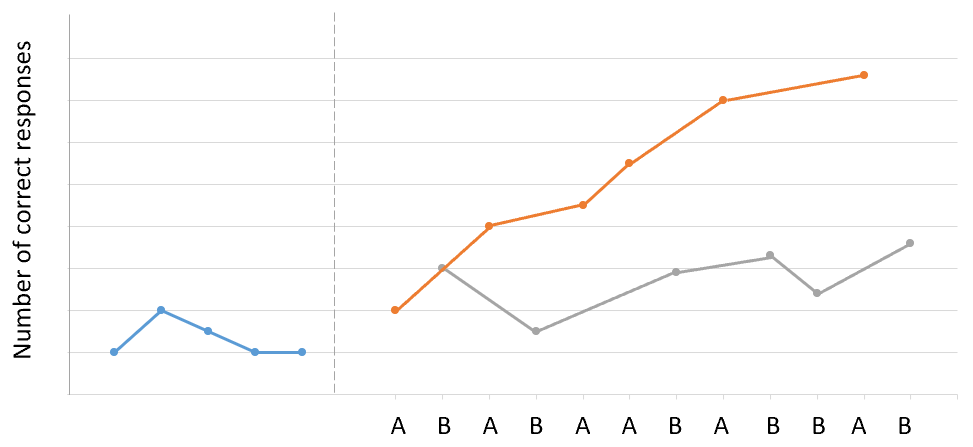
In this example graph, one intervention has a significantly greater effect on the target behavior than the other.
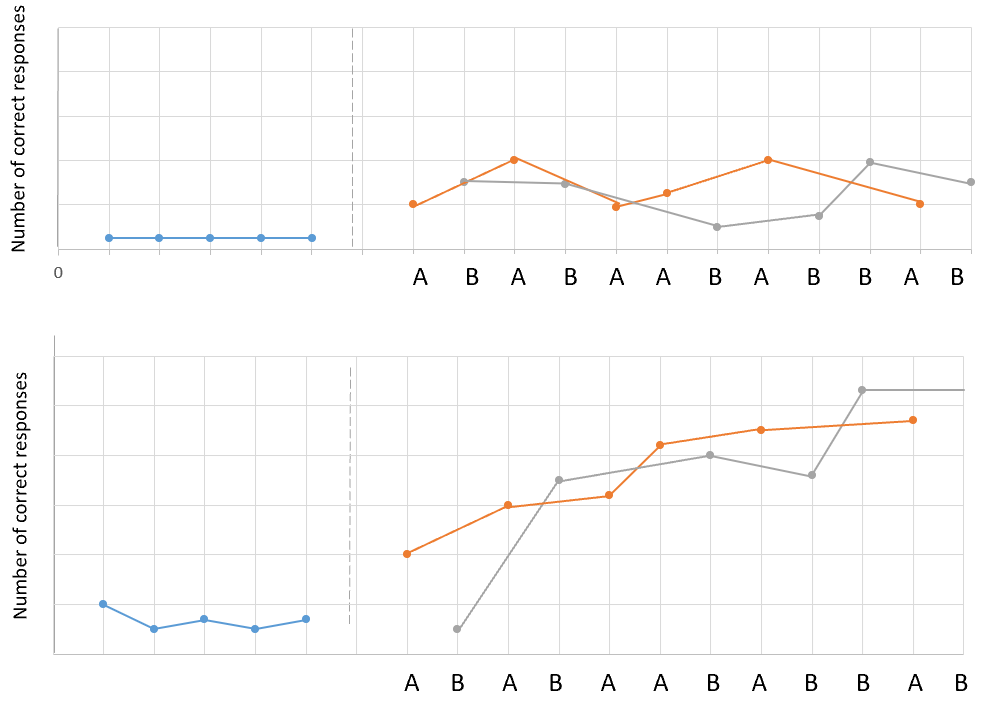
The next two graphs demonstrate no difference in therapy. Both interventions had no control over the dependent variable, as seen in the top graph. The interventions have influence on the dependent variable, as seen in the bottom graph. They overlap and grow in a similar way, implying that neither intervention has a considerably greater impact on the target behavior.
ABAB reversal design
The goal of the ABAB reversal design is to see how well a single intervention may change a target behavior. This is produced by introducing and then removing the intervention in order to assess its impact on the target behavior. Prior to applying the ABAB Design, the experimenter’s behavior-change plan determines the criterion for a successful intervention change.
There are four aspects to ABAB reversal design. Before the intervention is conducted, a baseline of target behaviors data is obtained in the first phase. The intervention is initially applied in the second phase, Intervention 1. The intervention is maintained until the criterion for successful target behavior modification has been met or a trend toward the criterion has been established. The third step, Baseline 2, is a return to baseline data by removing or stopping the intervention. The aim is for the target behavior to recover to a level around the mean of baseline 1 data after the intervention is discontinued. This return to the baseline indicates that the intervention had an effect on the target behavior. The intervention is reintroduced in the last phase, Intervention 2. The purpose of this phase is to duplicate the trend toward the intended target behavior criteria from the first phase of the intervention when it is executed again.

Before there can be claimed to be a functional relationship between the intervention and the target behavior, the ABAB design must satisfy three components. An instructional statement that a certain intervention will change the target behavior is required for prediction. During the intervention phase, the verification of prediction component is satisfied when the predicted increase or reduction in the target behavior happens. During the Baseline 2 phase, there must also be a return to the near baseline data values. The replication of the effects is the third component. This is accomplished by reintroducing the intervention during the Intervention 2 phase, which results in a comparable trend shift toward desirable target behavior performance.
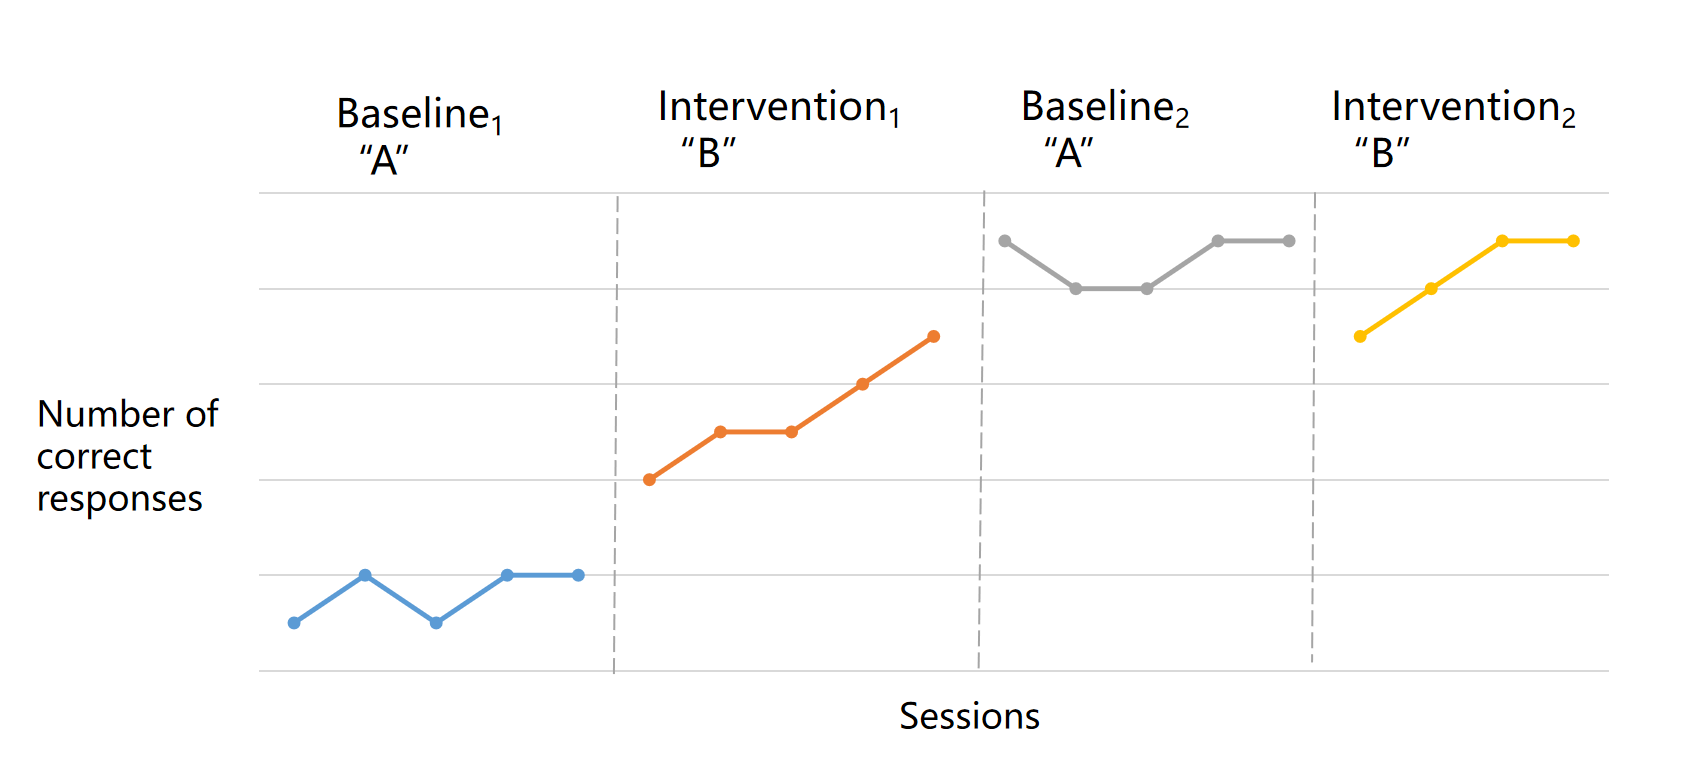
This graph demonstrates that the intervention and the target behavior have a functional relationship. A target behavior was reduced as a result of the intervention. Data restored to the original baseline after intervention was deleted. The behavior was then lowered a second time when it was implemented.

