Frequency data collection is a fundamental measurement system in applied behavior analysis that tracks how many times a behavior occurs. This method provides essential quantitative information about behavior patterns, intervention effectiveness, and progress monitoring. Understanding when and how to use frequency recording is crucial for both clinical practice and BCBA exam success.
Table of Contents
- What is Frequency Data Collection in ABA?
- Applying Frequency Data: Worked ABA Examples
- Frequency Data on the BCBA Exam: Common Traps and Tips
- Your Frequency Data Implementation Checklist
- Summary and Next Steps for Mastery
- References
What is Frequency Data Collection in ABA?
Frequency data collection involves counting each occurrence of a target behavior during a specified observation period. This event recording method is one of the most straightforward measurement systems in ABA, but requires careful implementation to yield meaningful data.
Definition: Count vs. Rate
The raw count of behaviors is called frequency, but this number alone has limited analytical value. To make data comparable across different observation periods, practitioners convert frequency to rate by dividing the count by the observation time. For example, 15 hand raises in 30 minutes equals a rate of 0.5 per minute or 30 per hour.
This conversion to rate allows for meaningful comparisons across sessions of varying lengths and helps identify patterns in behavior occurrence.
When to Choose a Frequency Data Collection Sheet
Frequency recording works best for behaviors with clear discrete boundaries and relatively short duration. Consider these criteria:
- Discrete behaviors with obvious start and end points
- Behaviors that occur relatively quickly and don’t last long
- When the primary question is “how many times?” rather than “how long?”
- Behaviors that don’t occur at extremely high rates (to avoid counting errors)
- When you need simple, objective measurement that multiple observers can reliably record

Applying Frequency Data: Worked ABA Examples
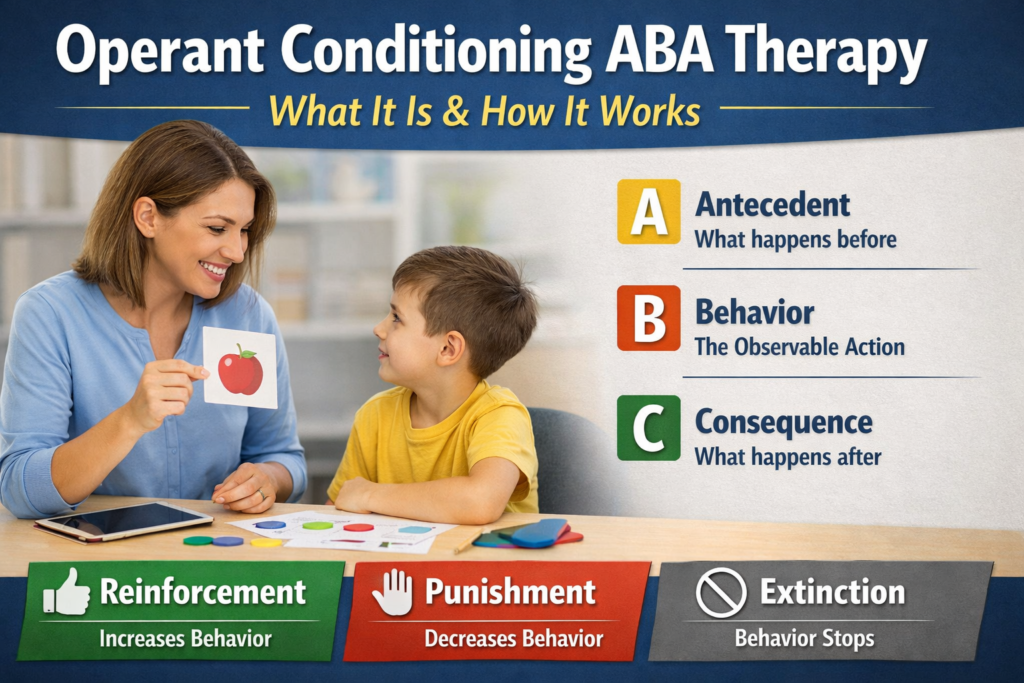
Let’s examine three practical scenarios where frequency data collection provides valuable behavioral insights. Each example includes ABC data (antecedent-behavior-consequence) and hypothesized function analysis.
Example 1: Hand Raising in a Classroom
Scenario: A student raises their hand during group instruction. The behavior is discrete, countable, and appropriate for frequency measurement.
- Antecedent: Teacher asks a question to the class
- Behavior: Student raises hand (counted each occurrence)
- Consequence: Teacher calls on student, provides praise
- Hypothesized function: Access to adult attention and participation opportunities
Data collection: Over a 45-minute session, the student raises their hand 12 times. Rate calculation: 12 ÷ 45 = 0.27 per minute or 16.2 per hour.
Example 2: Vocal Stereotypy During Independent Work
Scenario: A child engages in non-contextual vocalizations (humming, repeating phrases) during independent seatwork.
- Antecedent: Independent work time with minimal supervision
- Behavior: Non-contextual vocalization (each vocalization counted)
- Consequence: No social reaction, continues working
- Hypothesized function: Automatic reinforcement (sensory stimulation)
Important distinction: While frequency tells us “how many times,” duration might also be relevant if vocalizations are lengthy. However, frequency provides a simpler measure for intervention planning and progress monitoring.
Example 3: Elopement Attempts in a Clinic Setting
Scenario: A child moves toward or attempts to exit through doors during therapy sessions.
- Antecedent: Difficult task presented or transition demand
- Behavior: Movement toward door (each approach counted)
- Consequence: Blocked from exiting, task removed temporarily
- Hypothesized function: Escape from demands or unwanted activities
Safety consideration: For elopement, practitioners often combine frequency with latency measurement (time to first attempt) and implement safety protocols. Each discrete attempt provides valuable data about the behavior’s occurrence pattern.
Frequency Data on the BCBA Exam: Common Traps and Tips
BCBA exam questions often test your ability to select appropriate measurement systems and interpret frequency data correctly. Understanding common pitfalls can help you avoid costly mistakes.

Trap 1: Confusing Frequency with Rate or Duration
The exam frequently presents scenarios where you must choose the “best” measurement system. Remember this decision process:
- Is the behavior discrete with clear boundaries? → Consider frequency
- Does “how long” the behavior lasts matter more than “how many times”? → Choose duration
- Are you comparing data across different observation periods? → Convert frequency to rate
- Does the behavior occur at extremely high rates? → Consider partial-interval recording instead
Trap 2: Misapplying to Continuous or Long-Duration Behaviors
Frequency recording is inappropriate for behaviors that are continuous or have ambiguous boundaries. Poor fits include:
- On-task behavior (better measured with momentary time sampling)
- Tantrum episodes (duration or partial-interval better captures intensity)
- Social engagement during play (duration or interval recording more appropriate)
- Behaviors with variable topography that makes discrete counting difficult
Key Exam Terminology and Practice Prompts
Familiarize yourself with these essential terms:
- Event recording: Another name for frequency data collection
- Celeration: The change in rate over time (acceleration or deceleration)
- Count per minute/hour: Standard rate expressions
- Interobserver agreement for frequency: Smaller count ÷ larger count × 100
Sample exam question: “A behavior analyst records 25 instances of hand flapping during a 50-minute observation. What is the rate per hour?” Answer: (25 ÷ 50) × 60 = 30 per hour.
Your Frequency Data Implementation Checklist
Use this practical checklist to ensure proper frequency data collection in your practice:
- Define the target behavior operationally with clear start/end points
- Select an appropriate observation period that captures typical behavior patterns
- Train observers on the operational definition and counting procedures
- Use a simple data collection sheet with columns for date, time, count, and notes
- Calculate rate data after each observation session
- Regularly check interobserver agreement to ensure reliability
- Graph frequency/rate data to visualize trends and patterns
- Adjust measurement if behavior occurs at rates too high for accurate counting
- Combine with other measures (like ABC data collection) when functional analysis is needed
Summary and Next Steps for Mastery
Frequency data collection remains one of the most accessible and valuable measurement tools in ABA. Its simplicity makes it ideal for tracking discrete behaviors, monitoring intervention effectiveness, and making data-based decisions. Remember that converting counts to rates enables meaningful comparisons and trend analysis.
To deepen your understanding, explore related topics like duration measurement and interval recording systems. Practice calculating rates from various observation periods and interpreting frequency data graphs. For comprehensive exam preparation, consider our BCBA mock exam resources that include measurement system questions.
Mastering frequency data collection strengthens both your clinical skills and exam performance, ensuring you can select and implement appropriate measurement systems across diverse behavioral scenarios.